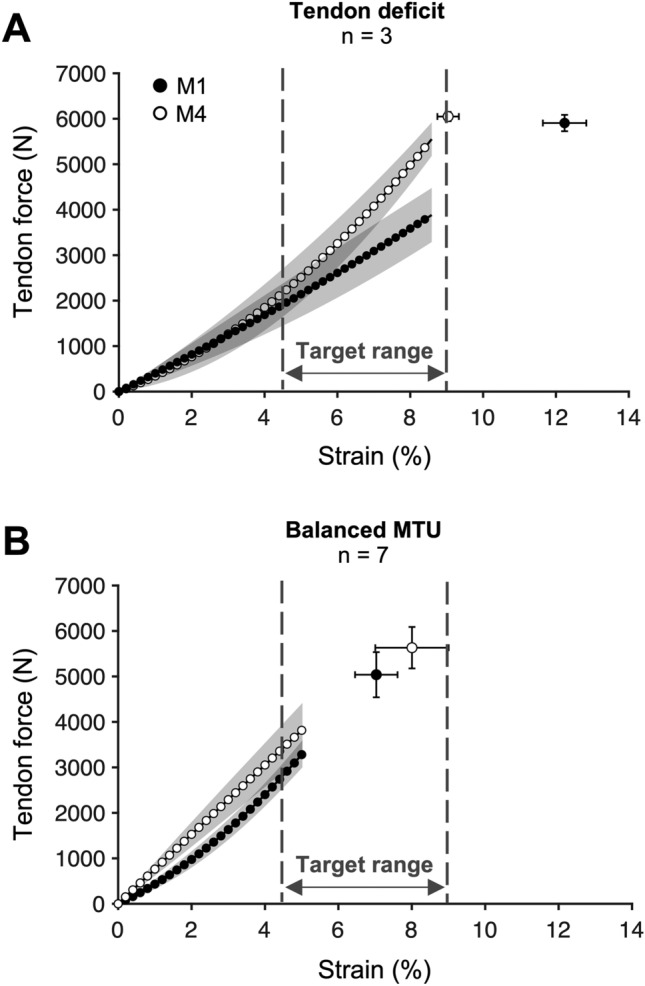
Fig. 6.

Patellar tendon force–strain relationship before (M1: black) and after (M4: white) the intervention period in the athletes participating in the personalized exercise program. Athletes with marked deficits in tendon stiffness in M1 (A) demonstrated a clear increase in normalized stiffness (i.e., slope of the force–strain relationship) and no increase in the maximum force applied to the tendon, which reduced maximum tendon strain to the upper margin of the proposed target range (i.e., balanced muscle strength and tendon stiffness). In athletes with a balanced muscle–tendon unit (MTU) at M1 (B), tendon strain remained within the target ranged despite an increase in the force applied to the tendon. Note that no statistical analysis was applied to these sub-groups due to the small sample size
