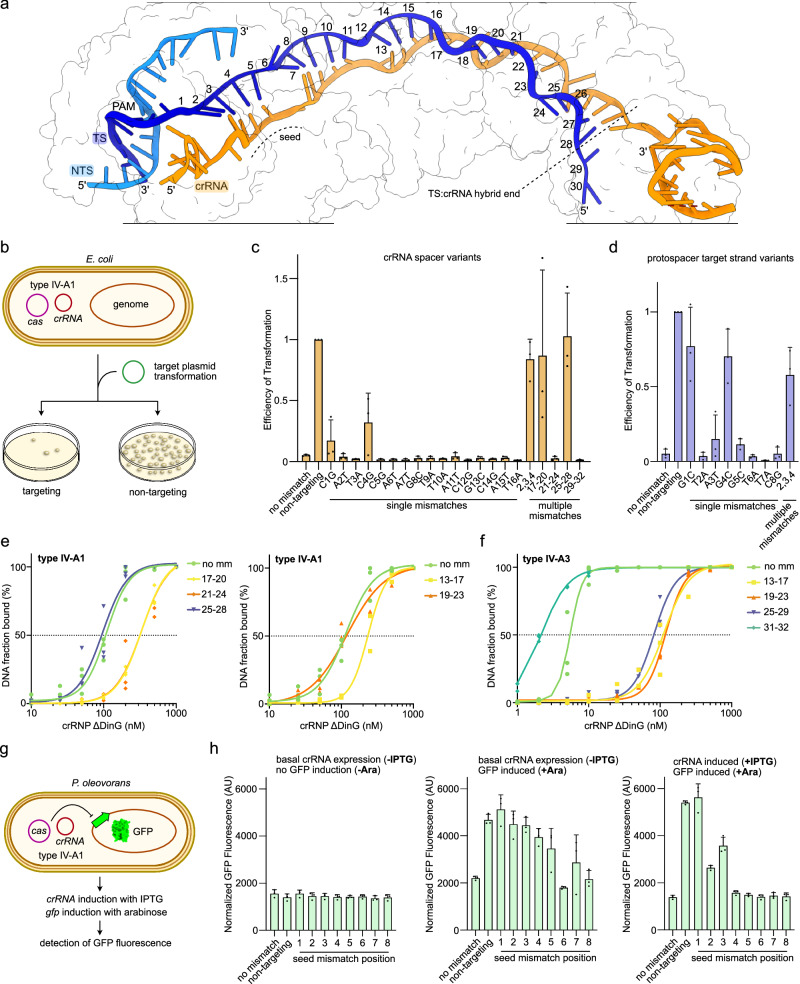
Fig. 4. Mismatch tolerance of type IV-A.
a Cryo-EM structure of the P. oleovorans type IV-A1 effector complex illustrating the R-loop formed by the target DNA (blue) and crRNA (orange). Protein subunits are shown as outlines. Protospacer target strand nucleotides are labeled according to their position. b Scheme illustrating the Efficiency of Transformation (EOT) assay. Cas proteins and crRNA are produced from separate expression plasmids. c, d EOT mismatch-tolerance assay with variable mismatching in spacer bases (c, orange bars) and protospacer bases on the target strand (d, blue bars). n = 3 independent replicates; mean ± s.d. Source data are provided as a Source Data file. e, f Electrophoretic mobility shift assays testing for the ability of types IV-A1 (e) and IV-A3 (f) complexes to bind non-mismatched (no mm) and mismatched DNA targets (mismatch ranges are labeled). n = 3 independent replicates; the no mm data in panel (e) is duplicated and shown in both graphs for reference. EMSA gels are shown in Supplementary Figs. 10, 11. Source data are provided as a Source Data file. g Scheme illustrating the P. oleovorans gfp repression assay. Type IV-A1 is natively expressed from the P. oleovorans megaplasmid and the gfp-targeting crRNA is expressed from a separate plasmid. h gfp repression mismatch tolerance (green bars) in uninduced cells (left), in cells with induced gfp (middle), and with induction of both, gfp and the gfp-targeting crRNA (right). n = 3 independent replicates; mean ± s.d. Source data are provided as a Source Data file.

