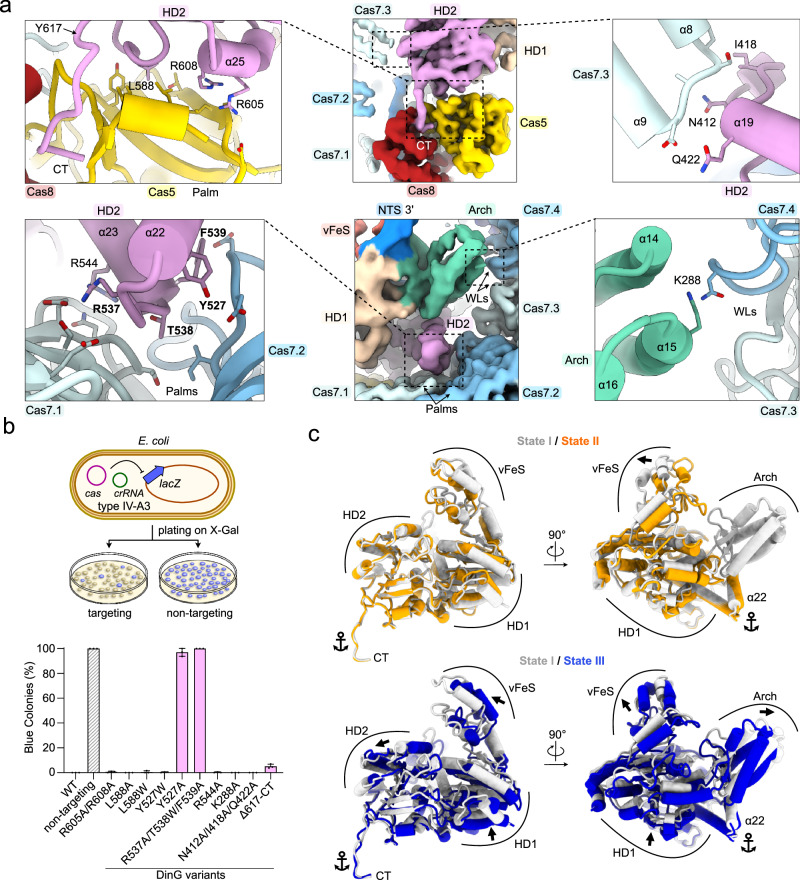
Fig. 8. Type IV-A3 DinG interface.
a Close-up views onto the DinG interfaces. The sharpened experimental cryo-EM map is shown in the center. Dashed lines highlight the position of individual interfaces, shown in the left and right insets. DinG residues are shown and labeled. Residues in proximity to DinG are shown and not labeled for clarity. b lacZ-CRISPRi assay probing amino acid substitutions in DinG. The scheme on top illustrates the assay setup. Coloring in the bar graph according to DinG domain coloring in Fig. 7b. n = 3 independent replicates; mean ± s.d. Residues producing strong interference defects upon substitution are highlighted in bold in panel a. Source data are provided as a Source Data file. c Comparison of DinG states, relative to the complex. The complex is not shown for clarity. Anchor symbols indicate elements that do not rearrange between all states. Arrows indicate rearrangements between individually compared states.

