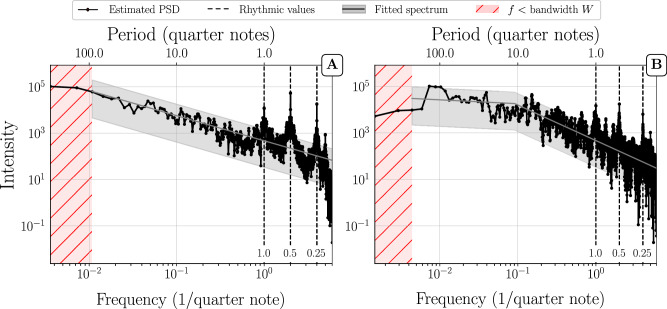
Fig. 1. Multitaper PSD estimation of single movements.
(A) Shostakovich’s Prelude and Fugue in B op. 87 no. 11 (first violin) and (B) Allegretto from Haydn’s String Quartet in D major, Hob.III:79 (first violin). Frequency and intensity are shown in a log-log representation and are shown in units of 1/quarter notes. Note, however, that we used a grid of 12 sub-units per quarter notes for the time series segmentation, which yields a highest frequency of 6/quarter note. For convenience, the top horizontal axis shows the time periods in quarter note units corresponding to the frequencies on the horizontal axis. As a grid of 12 sub-units per quarter note was used for the time-series segmentation, the time period is obtained as Period(quarter notes) = 1/12f. The shaded grey area represents a 95% confidence interval on the basis of the fitted PSD (grey line). The fitting procedure is described in the methods section. The vertical dashed lines mark frequencies corresponding to multiples and subdivisions of quarter notes. The shaded pink area represents frequencies below the bandwidth W. Example (A) is representative for a PSD with power-law (PL) down to the bandwidth W, and example (B) for a power-law + plateau (PL+P).

