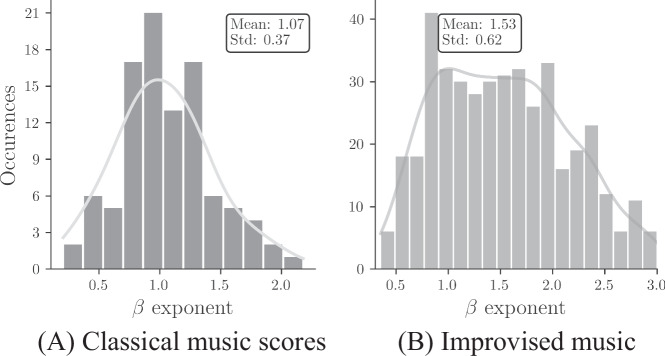
Fig. 6. Histogram representation of β exponent.
The exponents β were extracted from the power law regimes of the PSDs for (A) 94 classical music scores from online databases26–28 (B) 454 improvised jazz solos from the WJD29 based on the high to medium frequency part of piecewise linear fits. The continuous grey line is a guide to the eye obtained from a kernel density estimation. Note that the distribution has a somewhat larger mean and is broader for jazz solos than for classical music scores.

