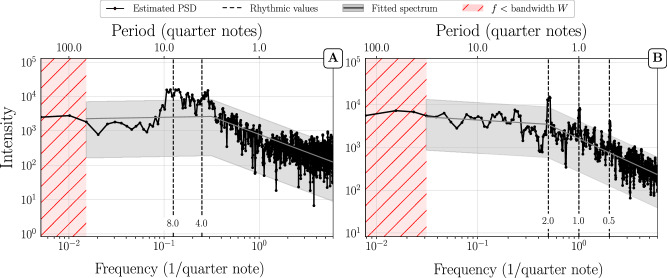
Fig. 8. Improvised solos.
Multitaper PSD estimation of (A) Benny Carter’s solo on “I Got It Bad” and (B) Buck Clayton’s solo on “Dickie’s Dream”. The shaded grey area represents a 95% confidence interval on the basis of the fitted PSD (grey line). Dashed vertical lines mark periods from 0.5 to 8 quarter notes. A shows that the rhythmic variability in some solos can considerably broaden the rhythmic peaks at 4 to 8 quarter notes. The flattening of the PSD at high frequencies is a quantization artifact: the solo contains rhythmic values shorter than the unit duration (1/12 quarter note) which results in a nearly random signal at the highest frequencies. B shows an example of a typical PL+P structure where rhythmic peaks are present. The peaks are visible but are not very pronounced compared to the peaks observed for classical music scores.

