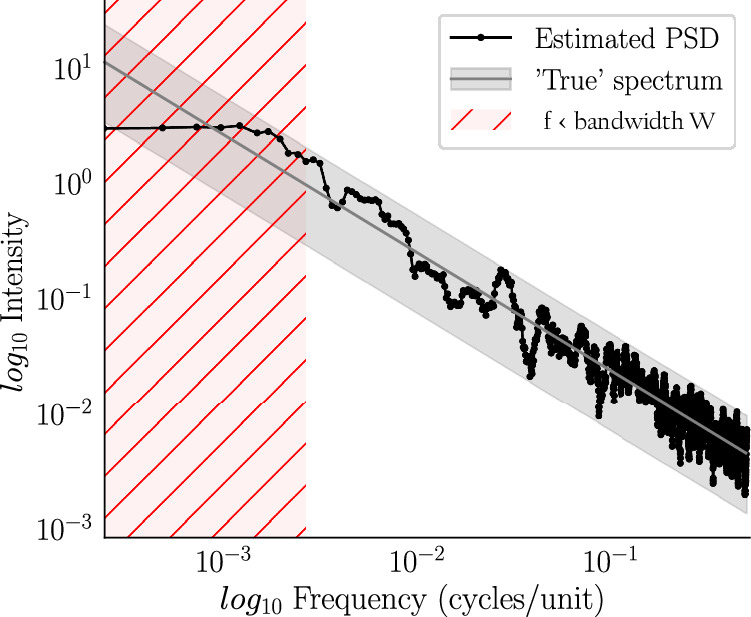
Fig. 9. Flattening bias.

The power spectral density of a simulated 1/f-noise time-series was estimated by the multitaper method with NW=2. In log-log representation the exact PSD follows a linear decay. The local bias, however, flattens the peak at the low end of the spectrum below the bandwidth frequency W. The grey shaded area represents a 95% confidence interval for the estimation based on the assumption of a linear relationship.
