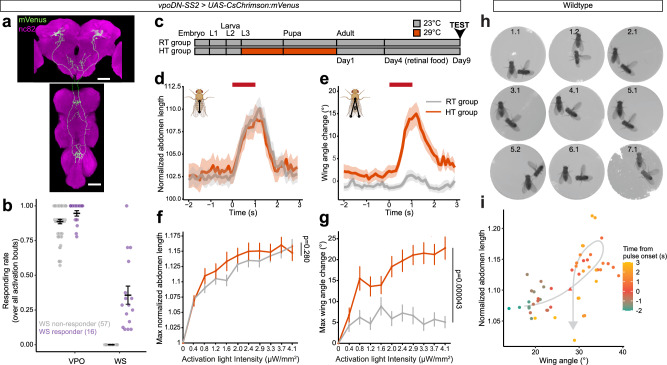
Fig. 5. Idiosyncratic and plastic latent potential of wing spreading in D. melanogaster.
a Confocal image of vpoDN neurons in D. melanogaster vpoDN-SS2 > UAS-CsChrimson:mVenus female brain and VNC. Scale bars: 50 µm. n = 12 biological replicates over 2 rounds. b Proportion of VPO and wing spreading (WS) events in response to 10 activation bouts with intensities ramping from 0.4 to 4.1 µW/mm2. Each dot represents an individual. Color represents whether an individual was scored as a WS responder or not. Error bars show mean ± SEM. c Schematic of how room temperature (RT) and high temperature (HT) groups were generated. d, e Mean normalized abdomen length (d) and wing angle change (e) of HT and RT flies at 4.1 µW/mm2. Activation window is denoted by bars above each plot. Shaded areas represent the SEM. Inset diagrams illustrate how abdomen lengths or wing angles were measured. f, g Maximum normalized abdomen length (f) and wing angle change (g) under each activation intensity. Curve and error bars show mean ± SEM. Two-sided Mann-Whitney U test was performed between RT and HT across all activation intensities. n = 91 (RT group), 80 (HT group). h WS onset frame of each of the 9 WS events observed in 7 courting wildtype pairs. Numbers denote “pair ID”.“event ID”. i Temporal relationship between normalized abdomen length and wing angle, averaged across all WS events. Pulse onset is marked as a triangle. Gray arrow behind data points represents an approximate progression of data points. n = 9 events from 7 females. Source data are provided as a Source Data file.

