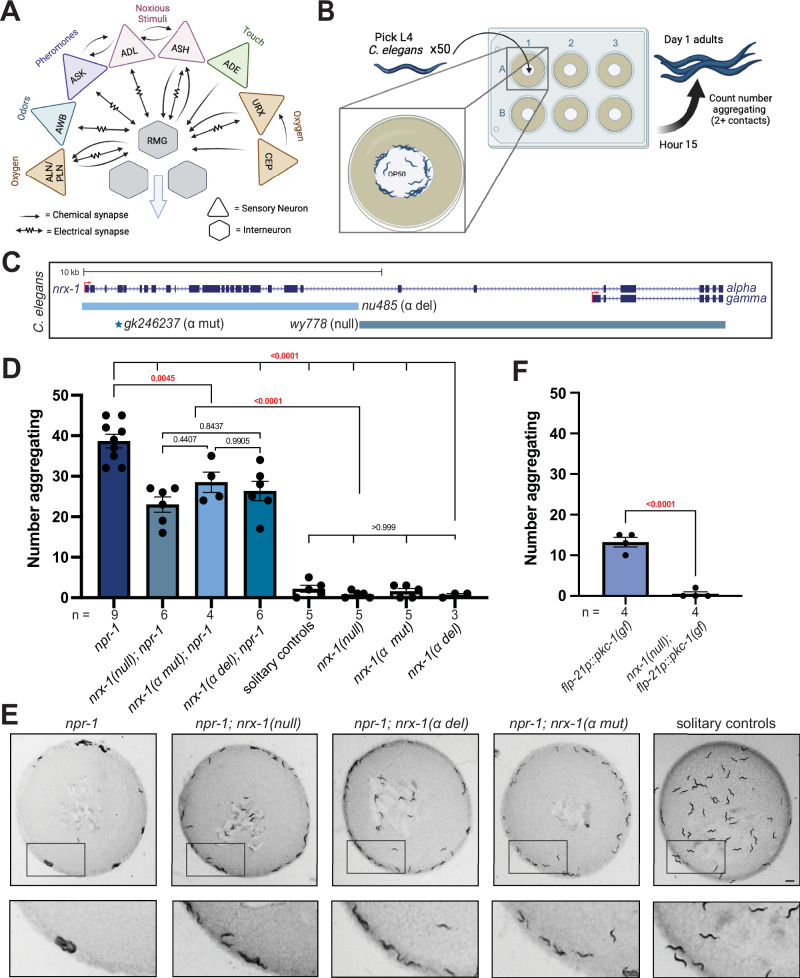
Fig. 1. NRX-1 is essential for aggregation behavior.
A Circuit diagram of sensory integration circuit. Connectome based on NemaNode and WormWiring data (Created in BioRender. Cowen, M. (2020) BioRender.com/g12s038). B Schematic of medium throughput aggregation behavior assay with 50 day 1 adult worms per well of a 6-well WormCamp imaged using WormWatcher platforms and scored for aggregation behavior defined as two or more animals in direct contact (Created in BioRender. Hart, M. (2023) BioRender.com/b48j541). C Schematic of C. elegans nrx-1 gene showing mutant alleles used and isoforms removed by functional null and α-isoform specific mutants. D Graph showing the number of aggregating animals in various genetic backgrounds. All mutant nrx-1 alleles (wy778 = nrx-1 null, gk246237 = nrx-1 α mut, nu485 = nrx-1 α del) show decreased aggregation behavior. E Representative images of aggregation behavior in npr-1(ad609), npr-1(ad609);nrx-1(wy778), npr-1(ad609);nrx-1(nu485), npr-1(ad609);nrx-1(gk246237) mutants, and solitary controls (Scale bar = 1 mm). F Graph showing the number of aggregating animals in flp-21p::pkc-1(gf) strain compared to flp-21p::pkc-1(gf);nrx-1(wy778). The number of biological replicates (n) are displayed in the figure, bars show the mean number of aggregating C. elegans, error bars indicate SEM. One-way ANOVA with Tukey’s post-hoc test was used for comparisons (t test for panel F), exact p-values are shown on graphs (red indicates significance, black indicates non-significance). Source data are provided in the Source Data file.

