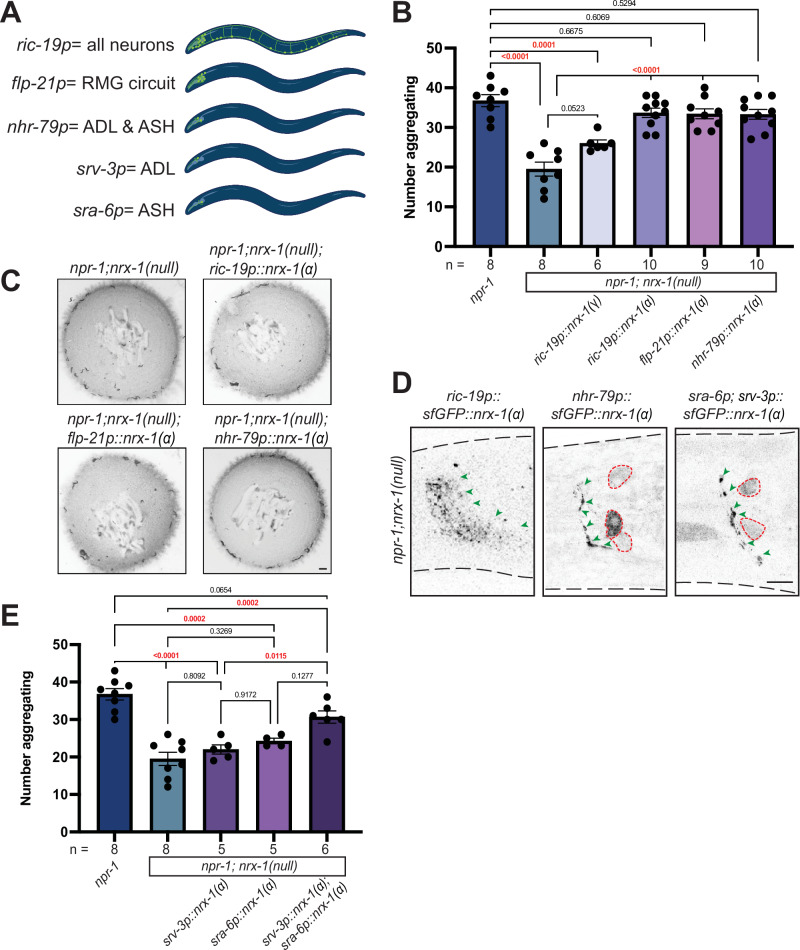
Fig. 2. NRX-1(α) acts in ADL and ASH sensory neurons for aggregate feeding.
A Schematics showing the neurons where each promoter is expressed. ric-19p expresses in all neurons, flp-21p expresses in several sensory neurons and RMG interneurons, nhr-79p expresses in ADL and ASH sensory neurons, srv-3p expresses in ADL neurons, and sra-6p expresses in ASH neurons (Created in BioRender. Hart, M. (2023) BioRender.com/w06b193). Graph showing number of aggregating animals (B) and representative images of aggregation behavior assay plates (C) in npr-1(ad609);nrx-1(null) mutants with NRX-1(α) driven by ric-19, flp-21, and nhr-79 promoters, and NRX-1(γ) driven by the ric-19 promoter, and controls (Scale bar = 1 mm). D Confocal image of NRX-1(α) expression in all neurons (ric-19p::sfGFP::nrx-1), ADL and ASH neurons (nhr-79p::sfGFP::nrx-1), and ADL and ASH neurons (sra-6p::sfGFP::nrx-1 & srv-3p::sfGFP::nrx-1). Green arrows indicate NRX-1 axonal expression. Red dashed lines show cell bodies. ric-19p::sfGFP::nrx-1(α) imaging performed in nrx-1(wy778) (Scale bar = 10 μm). E Graph showing the number of aggregating animals in various genetic backgrounds. Data for npr-1 and npr-1;nrx-1 are plotted in both 2B and 2E. The number of biological replicates (n) are displayed in the figure, bars show the mean number of aggregating C. elegans, and error bars indicate SEM. One-way ANOVA with Tukey’s post-hoc test was used for comparisons, exact p-values are shown on graphs (red indicates significance, black indicates non-significance). Source data are provided in the Source Data file.

