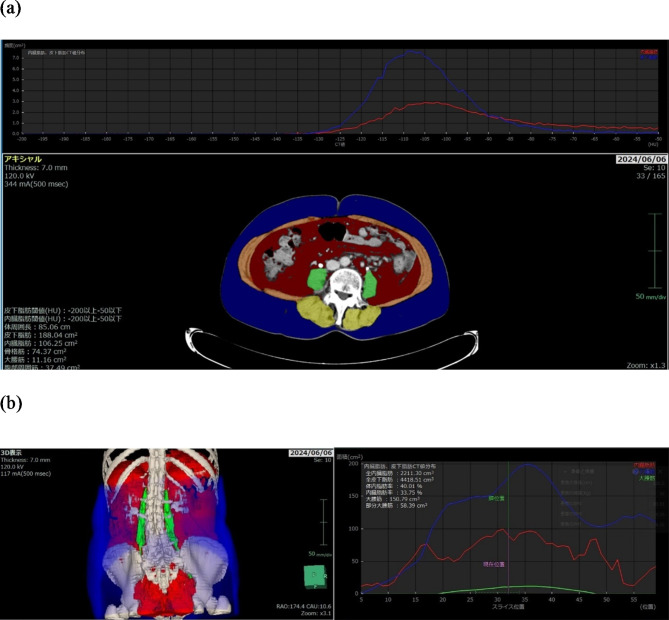
Fig. 1.
Representative images of body composition components were reconstructed using the SYNAPSE VINCENT 3-dimensional medical image analysis system. (a) Cross-sectional computed tomography image at the level of the umbilicus. Areas colored in yellow and orange indicate the skeletal muscle area, and those colored green indicate the psoas muscle area. (b) Three-dimensional image construction. Green areas indicate the total volume of the psoas muscle.

