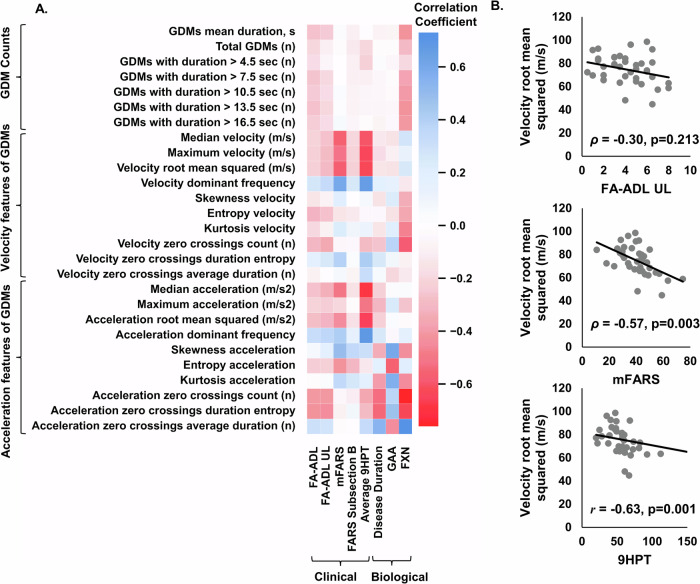
Fig. 2. Correlations between sensor-derived GDM and clinical scores and biological biomarkers.
A Correlation map displaying correlation coefficients (r or ρ) between 27 sensor-derived measures of GDM and clinical scores of FRDA, as well as disease duration, GAA and FXN. Spearman correlation analysis was used to quantify the relationship between sensor-derived metrics and clinical scores, including FA-ADL, FA-ADL UL, mFARS, and mFARS Subsection B. Meanwhile, Pearson correlation analysis was employed to evaluate the association between sensor-derived metrics and biological outcomes, such as GAA, FXN, average HPT, and disease duration. B Velocity root mean squared of GDMs versus FA-ADL, mFARS, and 9 HPT. Data represent n = 39 participants. All GDM metrics are averaged daily values measured over 7 consecutive days.

