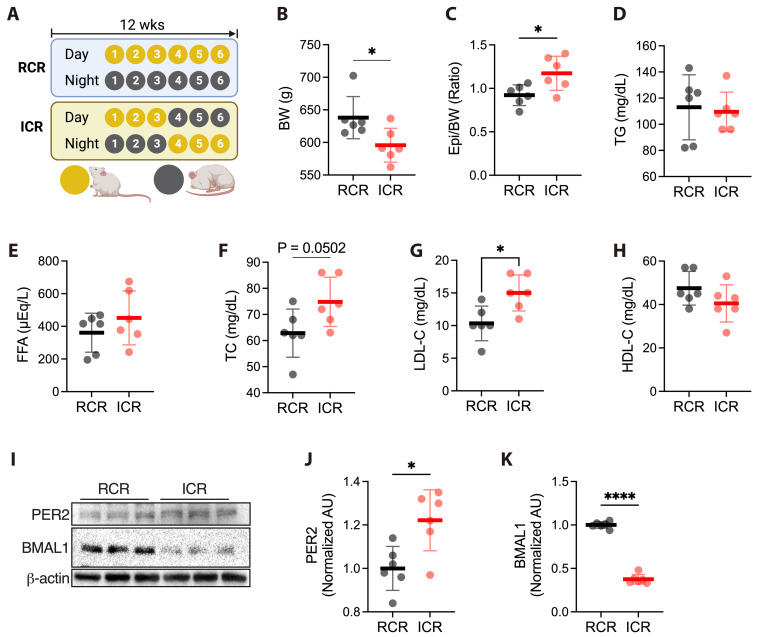
Fig. 2. CR disturbance altered blood profiles by increasing LDL-C levels despite decreasing body weight (BW).
(A) Induction of 12 weeks CR disturbance on RCR (n = 6 rats per group) and ICR (n = 6 rats per group) groups. Significant changes include (B) BW decrease (C) epididymal fat mass to body weight ratio increase (Epi/BW). No meaningful change was observed in (D) TG, (E) FFA, (F) TC, (G) LDL-C, and (H) HDL-C levels. (I) A Western blot analysis of circadian clock protein levels reveal a significant difference in expression (I-K). All data are presented as mean ± SEM. CR, circadian rhythm; TC, triglyceride; FFA, free fatty acid; LDL-C, low-density lipoprotein cholesterol; HDL-C, high-density lipoprotein cholesterol; RCR, regular circadian rhythm; ICR, irregular circadian rhythm; PER, period circadian regulator 2; BMAL1, brain and muscle ARNT-like 1. *p < 0.05, ****p < 0.0001 as determined using Student’s t-test (n = 6).

