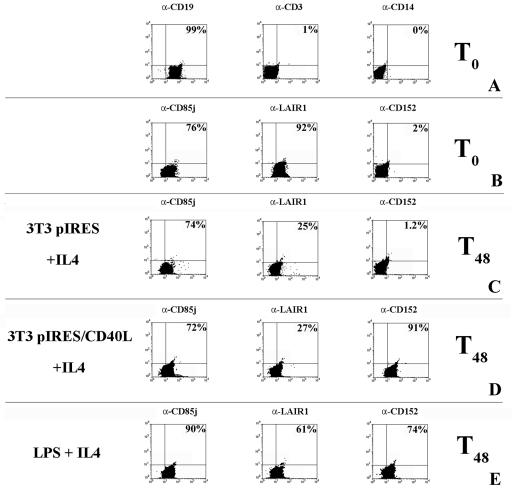
FIG. 1.
Expression of inhibitory molecules on the surface of B lymphocytes. CD85j, LAIR-1, and CD152 expression was evaluated by surface staining and flow cytometric analysis. (A) Percentages of purified B cells (CD19+), contaminant T cells (CD3+), and monocytes (CD14+). α-CD19, anti-CD19 antibody. (B) Inhibitory receptor expression in unstimulated B lymphocytes. (C) Surface expression of inhibitory molecules 48 h after stimulation with 3T3 pIRES cells plus IL-4 (a control for CD40L stimulation). (D) Surface expression of inhibitory molecules 48 h after stimulation with 3T3 pIRES/CD40L cells (CD40L-transfected cells) in the presence of IL-4. (E) Surface expression of inhibitory molecules 48 h after stimulation with LPS plus IL-4. The percentages of positive cells are shown.

