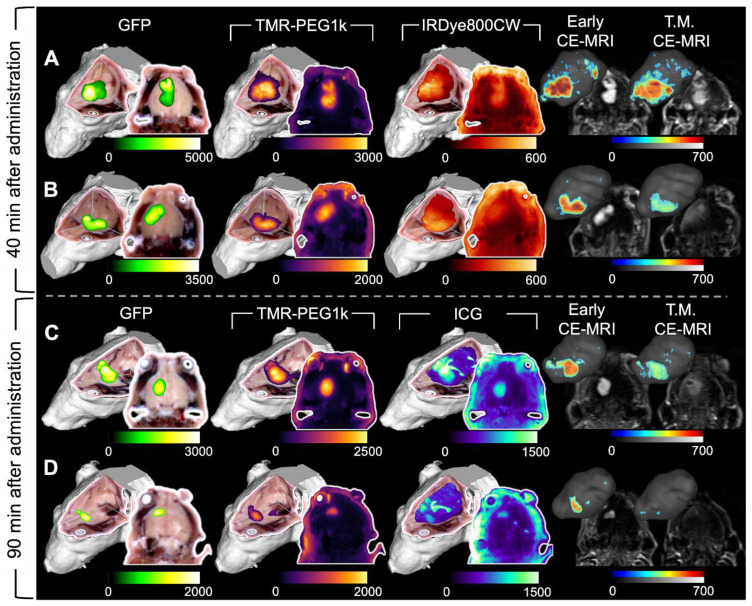
Figure 6.
Representative cryo-imaging and CE-MRI image volumes of mice with U87-GFP tumors 40 and 90 min after agent administration. Same structure as presented in Figure 2 and 3, each row represents one animal. (A-B) Show images of animals 40 min after administration. The columns from left to right show the GFP rendering, TMR-PEG1k, IRDye800CW, Early CE-MRI and T.M. CE-MRI. (C-D) Show images of animals 90 min after administration of TMR-PEG1k and ICG with an analogous column arrangement as described for A-B. Thresholding and units are identical to Figure 2 and 3.

