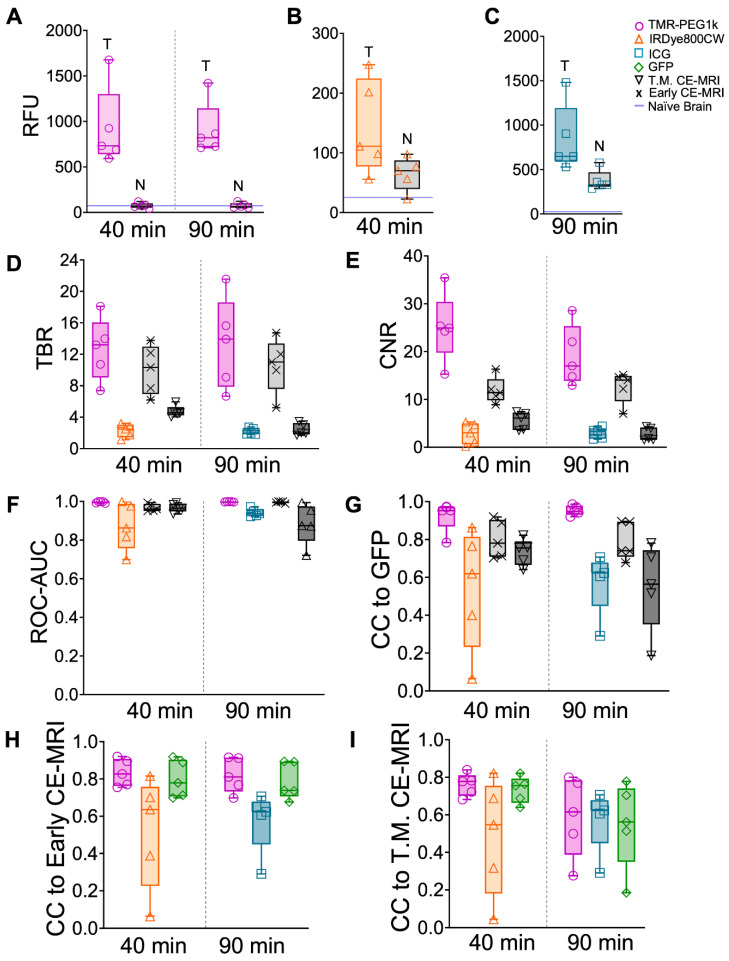
Figure 7.
Fluorescent contrast agent uptake, contrast evaluation and diagnostic evaluation in whole brains of mice with U87-GFP tumors. (A-C) shows mean fluorescence intensity values of brain and tumor tissues for each fluorescent contrast agent presented as a box and whisker plot for (A) TMR-PEG1k, (B) IRDye800CW and (C) ICG. Each dot represents the mean intensity for an individual animal and the blue line indicates the value for a naïve brain from that fluorescence imaging channel. (D) Tumor-to-background (TBR) ratio for all contrast agents, including CE-MRI, at each timepoint represented as a boxplot with and interquartile range (IQR). Contrast-to-noise (CNR) ratio for all contrast agents at each timepoint represented as a boxplot and IQR. (F) Area under the receiver operating characteristic curve (ROC-AUC) values at each timepoint for all contrast agents and all animals. Normalized cross-correlation (CC) with GFP (G), Early CE-MRI (H) and T.M. CE-MRI (I) for each fluorescent contrast agent at every timepoint, represented as a median with IQR.

