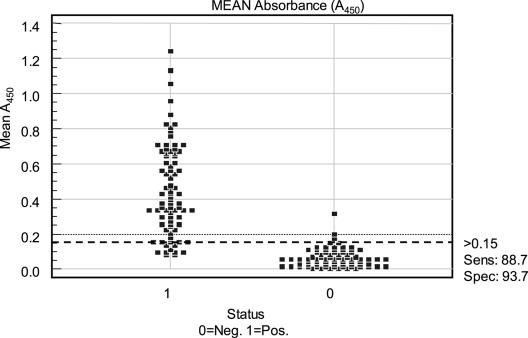
FIG. 3.
Scatter plot of the mean A450 values for anti-Lawsonia antibody-positive and -negative serum samples. The y axis depicts mean A450 values, and the x axis depicts sample set identification. 0, negative (Neg.); 1, positive (Pos.) for anti-Lawsonia antibodies. The dashed black line at the A450 of 0.15 signifies the positive/negative cutoff value. Sens, sensitivity; Spec, specificity.

