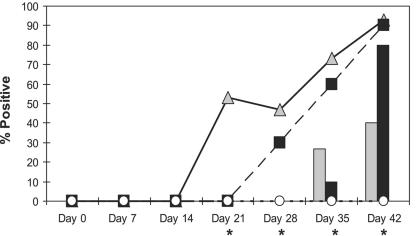
FIG. 4.
IFAT versus indirect LPS ELISA; rates of seroconversion to L. intracellularis among treatment groups. *, significant differences in seroconversion among groups and assay types (chi-square/Fisher's exact test and two-sample test of proportions, P < 0.05). The bar graph represents the mean percentage of IFAT positives for treatment groups throughout the study. Vaccinates, grey bars; challenge controls, black bars; strict controls, white bars (not visible, 0%). The line graph represents the mean percentage of LPS ELISA positives for treatment groups throughout the study. Vaccinates, solid line with grey triangles; challenge controls, dashed line with black squares; strict controls, dashed line with white circles; x axis, each day of the study that serum samples were tested for anti-Lawsonia IgG; y axis, mean percentage of anti-Lawsonia antibody positive pigs.

