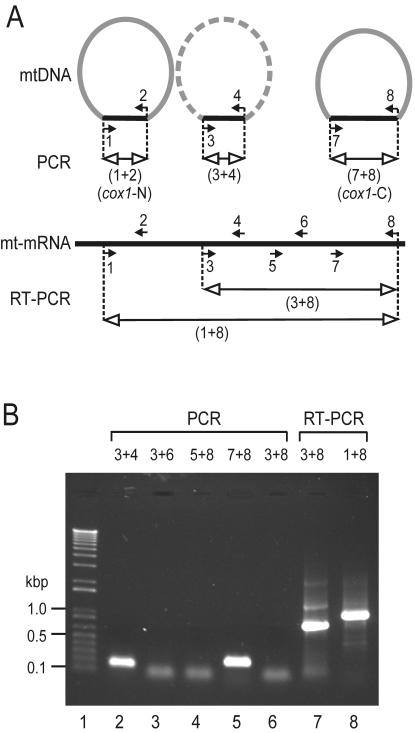
FIG. 7.
PCR amplification of the D. papillatum cox1 gene. (A) Schematic representation of the cox1 sequence and PCR primers. Semicircular forms indicate mtDNA chromosomes, with the cox1 coding region in black and the rest of the chromosome in gray. The existence of the corresponding chromosome remains to be demonstrated (symbolized by the dashed arc), but the cox1 region has been obtained by PCR. The chromosome depicted on the left gave rise to the genomic cox1 clone, which was isolated by D. Maslov and sequenced by us (this report). Filled small arrows with numbers indicate primers and their orientations. Lines with open arrowheads depict PCR products. The portion of mitochondrial mRNA between primers 3 and 8 corresponds to the published cox1 cDNA sequence (GenBank accession no. AF119813 [40]). (B) Electrophoretic separation of PCR products. Lane 1, size marker as in Fig. 3; lanes 2 to 6, mtDNA was PCR amplified using different primer pairs as indicated above the lanes. The numbers refer to the primers in Fig. 7A. Lanes 7 to 8, total RNA was reverse transcribed and PCR amplified using primer set 3 and 8 and primer set 1 and 8, respectively. The diffuse bands migrating at ∼50 bp in lanes 3, 4, 6, and 7 are most likely primer dimers, as they also occur in control experiments without DNA (not shown). For primer sequences, see Materials and Methods.

