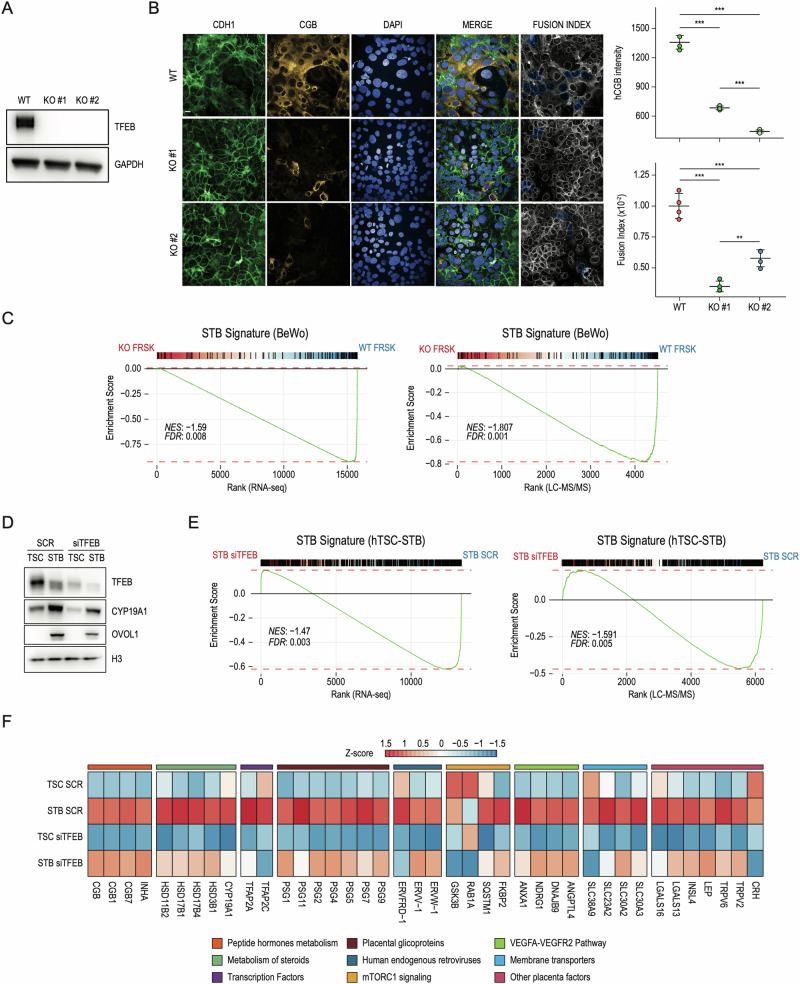
Fig. 3. Lack of TFEB impairs STB formation.
A Representative image of immunoblot analysis of TFEB expression in wild-type (WT) and CRISPR-Cas9 TFEB knock-out (KO#1 and KO#2) cells. GAPDH was used as a loading control. B (Left) Representative immunofluorescence images of wild-type (WT) cells and TFEB knock-out (KO#1 and KO#2) cells upon Forskolin (FRSK) treatment immunostained for E-Cadherin (CDH1) and human chorion gonadotropin β subunit (CGB). Nuclei are counterstained blue using DAPI. Lack of CDH1 staining combined with DAPI fluorescence was used to denote clusters of fused cells (Fusion Index, see “Methods”). Scale bar 20 µm. (Right) High-content imaging-based quantification of CGB intensity and proportion of fused cells upon indicated treatments (n = 4) shown as dot plots. Statistical analysis was performed by One-way analysis of variance (ANOVA) followed by Tukey’s multiple comparisons test (*p ≤ 0.05; **p ≤ 0.01; ***p ≤ 0.001). C Gene-set enrichment Analysis was performed on genes ranked by their fold-change and significance (see Methods) in FRSK-treated BeWo cells upon TFEB KO against WT cells in both RNAseq (left) and LC–MS/MS (right). Upregulated genes from panel in Fig. S1A (STB signature - BeWo) were used as geneset. Normalized Enrichment Score (NES) and False Discovery Rate (FDR) are reported. D Representative image of immunoblot analysis of TFEB, CYP19A1 and OVOL1 levels in human naive IPSC-derived trophoblast stem cells (TSC) and differentiated syncytiotrophoblast (STB) treated with siRNA targeting TFEB (siTFEB) and scramble sequences (SCR). H3 was used as a loading control. E Gene-set enrichment Analysis was performed on genes ranked by their fold-change and significance (see Methods) in syncytiotrophoblast (STB) treated with siRNA targeting TFEB (siTFEB) against human IPSC-derived trophoblast stem cells (TSC) in both RNAseq (left) and LC–MS/MS (right). Upregulated genes from panel in Fig. S1D (STB signature - TSC-STB) were used as geneset. Normalized Enrichment Score (NES) and False Discovery Rate (FDR) are reported. F: Heatmap of Z-scored log2-normalized expression values of selected differentially expressed genes in human naive IPSC-derived trophoblast stem cells (TSC) and differentiated syncytiotrophoblast (STB) treated with siRNA targeting TFEB (siTFEB) and scramble sequences (SCR). Genes displayed were grouped into categories indicated on the bottom.

