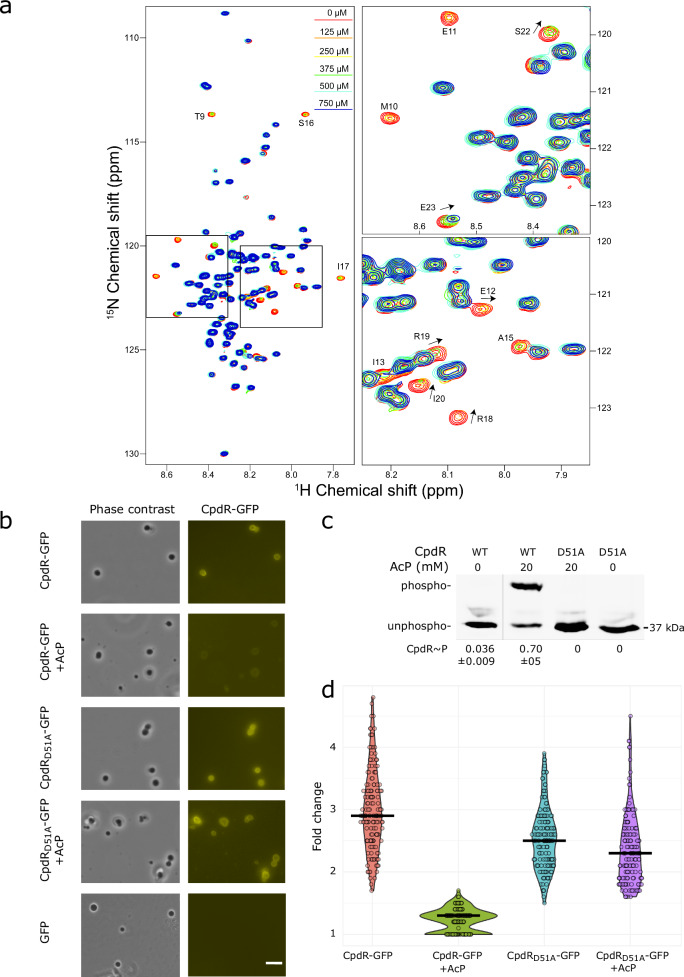
Fig. 3. Direct interaction between CpdR and PopZ is inhibited by phosphorylation.
a Left: 1H-15N TROSY-HSQC NMR spectra overlay of 50 μM 15N-enriched PopZΔ134–177 with varying concentrations of CpdR-GFP: 0 μM (red), 125 μM (orange), 250 μM (yellow), 375 μM (green), 500 μM (cyan), and 750 μM (blue). Right: Enlarged regions highlight the changes observed with increasing CpdR-GFP concentration. Residues with the most significant perturbations are labeled, with arrows indicating the direction of the peak shift. b CpdR-GFP, CpdRD51A-GFP, or GFP alone was incubated with PopZ condensates. Phase contrast and YFP fluorescence channels are shown. +AcP = pre-incubation with acetyl phosphate. Scale bar = 10 μm. c CpdR-GFP phosphorylation levels in samples from (b), observed using Phos-tag gel electrophoresis. Figure panel shows a single gel from which irrelevant lanes are removed. The average intensities of the phosphorylated bands as a fraction of the sum of band intensities from 3 biological replicates are provided, along with the standard deviation between replicates. Replicate gels are provided in Supplementary Fig. 3a. d Ratios of the CpdR-GFP and CpdRD51A-GFP fluorescence intensities within condensates to outside condensates, imaged in YFP channel. Violin plot widths are proportional to the number of data points, bar shows population average. n = 150 condensates per sample (50 per biological replicate). Source data are provided as a Source Data file.

