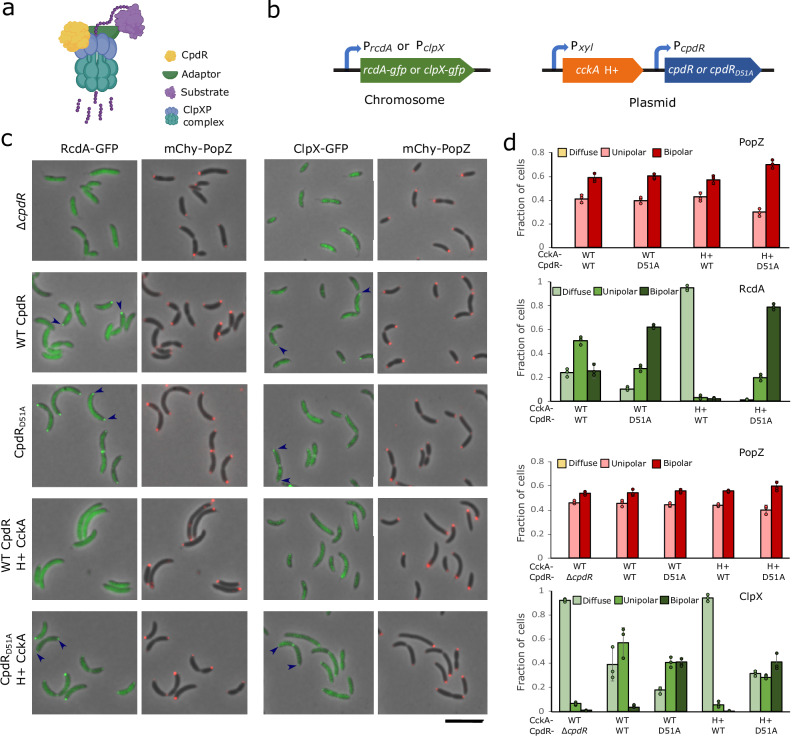
Fig. 4. Correlations between CpdR phosphorylation state and the localization of protease components.
a Diagram of CpdR-mediated substrate degradation by ClpXP. Depending on the substrate, an additional adaptor (green) could be RcdA and/or PopA. Graphics: BioRender. b Genetic modifications for observing RcdA -GFP or ClpXP -GFP in different CpdR phosphorylation contexts, built in a ∆cpdR; popZ::mChy-popZ C. crescentus strain background. c Localization of RcdA-GFP or ClpX-GFP and mChy-PopZ in different CpdR phosphorylation contexts. Arrowheads mark polar localization; scale bar = 5 μm. d The average frequencies of cells with diffuse, monopolar, and bipolar fluorescent foci in (c) (n > 100/replicate, bar = standard deviation of 3 biological replicates). Source data and n values for (d) is provided as a Source Data file.

