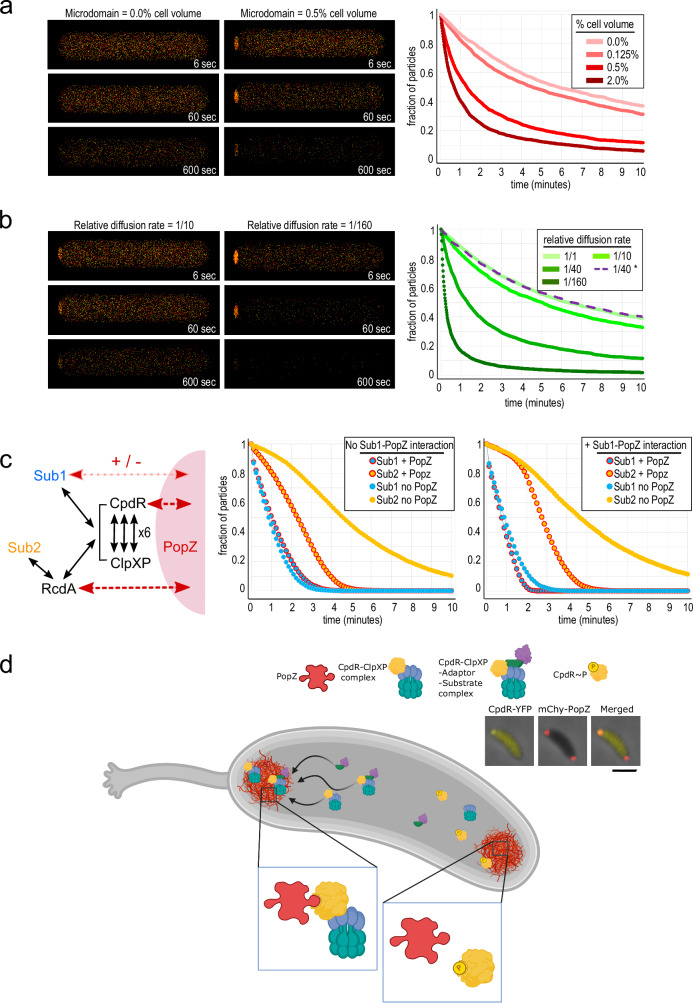
Fig. 6. Conceptual models of substrate proteolysis in membraneless polar microdomains.
a, b Three-dimensional reaction-diffusion simulations with two types of particles, colored red and yellow, that disappear after colliding. Snapshots of cells from the indicated time during simulation are shown at left, and the number of particles remaining over time under different parameter conditions are shown at right. a Effect of varying the size of the polar microdomain while holding the particle diffusion rate at 1/40th the rate in bulk cytoplasm. b Effect of varying particle diffusion rates within polar microdomains while holding polar microdomain size at 0.5% of total cell volume, or of limiting polar concentration to only one reactant (dotted line). c A model of C. crescentus proteolysis that includes low-affinity interactions (black arrows) between substrates (Sub1 and Sub2), adaptors, and ClpXP protease, in which some proteins interact directly with PopZ (red arrows) and become concentrated in polar microdomains. Charts show the fractions of substrate particles remaining in simulations run with or without PopZ, either without (left) or with (right) a direct interaction between Sub1 and PopZ. d Localization of CpdR and associated ClpXP complexes as a consequence of asymmetric CckA signaling activity. Inset panels show fluorescence images of a C. crescentus stalked cell, where mChy-PopZ is localized to both poles and CpdR-YFP is localized to only the stalked pole. Scale bar = 10 μm. Source data are provided as a Source Data file. Graphics: BioRender.

