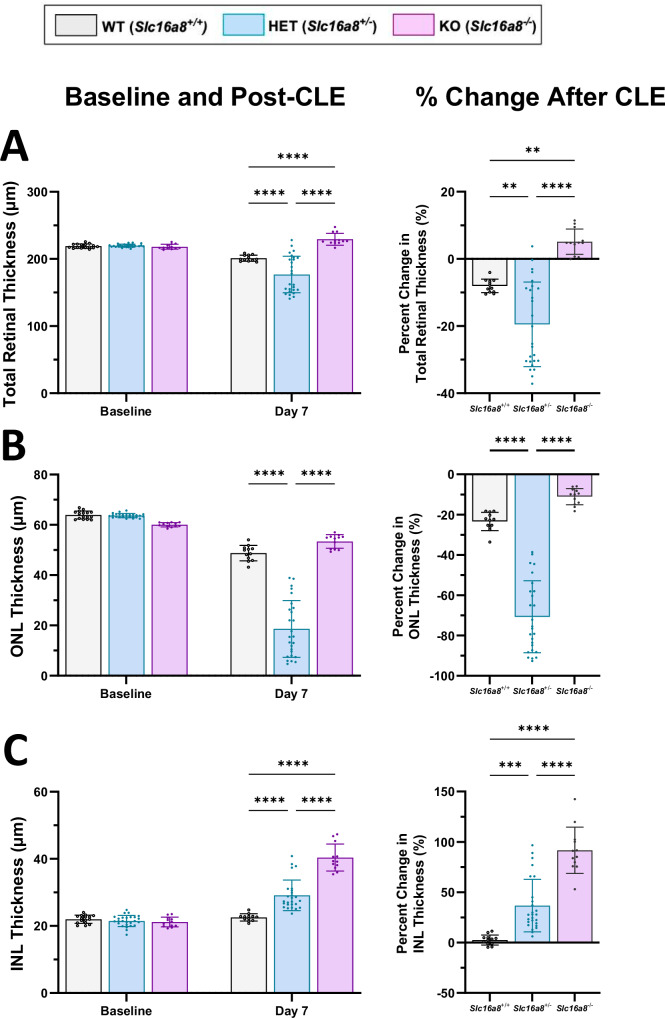
Fig. 5. OCT measurements of total, ONL, and INL retinal thickness before and after CLE-induced damage.
Total retinal, ONL and INL thickness were measured (µM) (A-C; left panels) by OCT at baseline and Day 7 of CLE. All data shown as mean ± SD, all n ≥ 12 eyes. Percent change following CLE are shown for Total, ONL and INL thickness in right panels (Mean ± SD). A For total retina thickness (µm) at baseline: Slc16a8 WT (219.11 ± 3.19), Het (219.86 ± 2.24), and KO (218.18 ± 3.6). For total retinal thickness (µm) at day 7: WT (201.11 ± 4.5), Het (176.91 ± 27.3), and KO (229.32 ± 8.9). For total retinal thickness at day 7 all P < 0.0001. For % change total retinal thickness (µm) WT (-8.07 ± 2.0), Het (-19.50 ± 12.59), and KO (5.11 ± 3.77). For % change total retinal thickness (µm) WT vs. Het (P < 0.01), WT vs. KO (p val<0.01), and Het vs. KO (p val<0.0001). B For ONL thickness at baseline: WT (63.93 ± 1.57), Het (63.93 ± 0.82), and KO (60.03 ± 0.85). For ONL thickness (µm) at day 7: WT (48.79 ± 3.06), Het (18.61 ± 11.3), and KO (53.40 ± 2.73). For ONL thickness (µm) at day 7: WT vs Het and Het vs. KO (p val<0.0001). For % change ONL thickness (µm) ONL WT (-23.39 ± 4.54), Het (-70.72 ± 17.84), and KO (-11.07 ± 4.03). C For INL thickness (µm) at baseline: WT (21.98 ± 1.22), Het (21.48 ± 1.65), and KO (21.15 ± 1.45). For INL thickness (µm) at day 7: WT (22.55 ± 1.05), Het (29.13 ± 4.56), and KO (40.38 ± 4.03). For INL thickness all p val<0.0001. For % change INL thickness (µm) WT (2.60 ± 5.02), Het (36.86 ± 26.11), and KO (91.70 ± 23.0). For % change INL thickness (µm) WT vs. Het (p val<0.001), WT vs. KO p val<0.0001), Het vs. KO (p val<0.0001). For total, ONL, and INL thickness comparisons: (A–C; left panels). Mixed-effects analysis (interaction between genotype and timepoint as follows TRT: F(2, 98) = 29.97, P < 0.0001, ONL: F(2, 98) = 102.9, P < 0.0001, INL: F(2, 98) = 67.21, P < 0.0001), multiple comparisons reported are between groups within timepoints, Sidak post-hoc., (A–C; right.panels) One-way ANOVA (TRT: F(2, 47) = 28.75, P < 0.0001, ONL: F(2, 47) = 102.9, P < 0.0001, INL: F(2, 47) = 49.78, P < 0.0001), Sidak post-hoc % Change computed as (Day 7 – Baseline)/Baseline *100.

