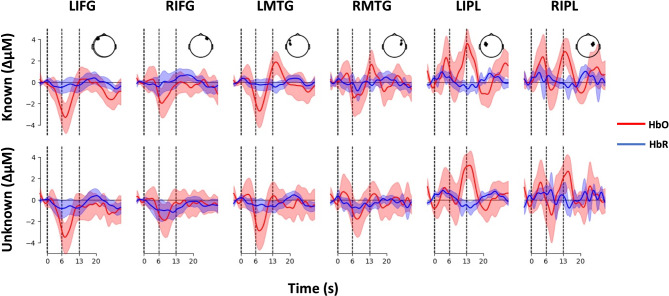
Fig. 2.
Waveform of cortical activation in bilateral inferior frontal gyrus (IFG), middle temporal gyrus (MTG), and inferior parietal lobule (IPL) measured using fNIRS. HbO = oxygenated haemoglobin; HbR = deoxygenated haemoglobin. Dotted vertical lines indicate 6 s (end of video viewing) and 13 s (end of viewing and responding to aesthetic judgment), respectively. Inset head diagrams show optode location for each ROI. Shaded areas along the waveform represent the 95% confidence interval.

