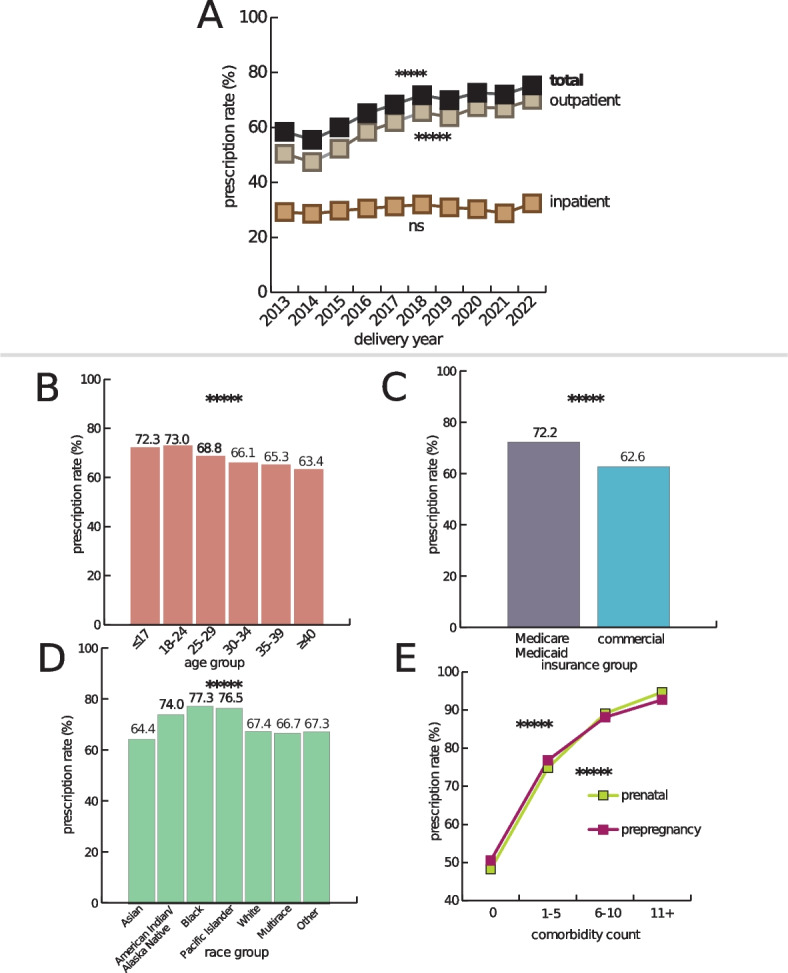
Fig. 1.

Overall prescription rate of PSJH pregnant population. A Plot shows the increase in total prescription rate from 2013 to 2022. The total medication prescription rate increased from 58.5 to 75.3% from 2013 to 2022 (P < 0.0001). The inpatient prescription rate increased from 29.3 to 32.4% (P = 0.2). In contrast, outpatient medication prescriptions increased from 50.5 to 70.1% (P < 0.0001). We evaluated the increase in prescription rate using linear regression. B Plot shows the total prescription rate across age groups (P < 0.0001). We evaluated the decrease in prescription rate across ages using linear regression. C Plot shows the difference in prescription rates between insurance groups (P < 0.0001). We evaluated the difference in prescription rate across categorical variables using the chi-square test. D Plot shows the difference in prescription rate across race groups (P < 0.0001). We evaluated the difference in prescription rate across categorical variables using the chi-square test. E Plot shows the increase in prescription rate based on comorbidity count. The increase in prescription rate across comorbidity count using linear regression
