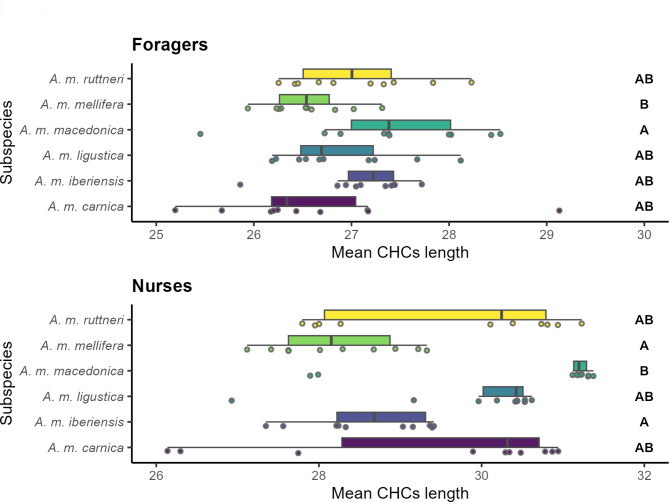
Fig. 4.
Box plot of the weighted mean chain length of hydrocarbons in the CHC profile of worker bees of different A. mellifera subspecies. The figure is divided regarding the task of the worker bees (foragers and nurse bees). Subspecies that significantly differ (p-value < 0.050) are labeled with different letters. Significance of pair-wise comparisons was obtained with Dunn’s tests and a FDR Benjamini & Hochberg adjustment, after a Kruskal Wallis tests

