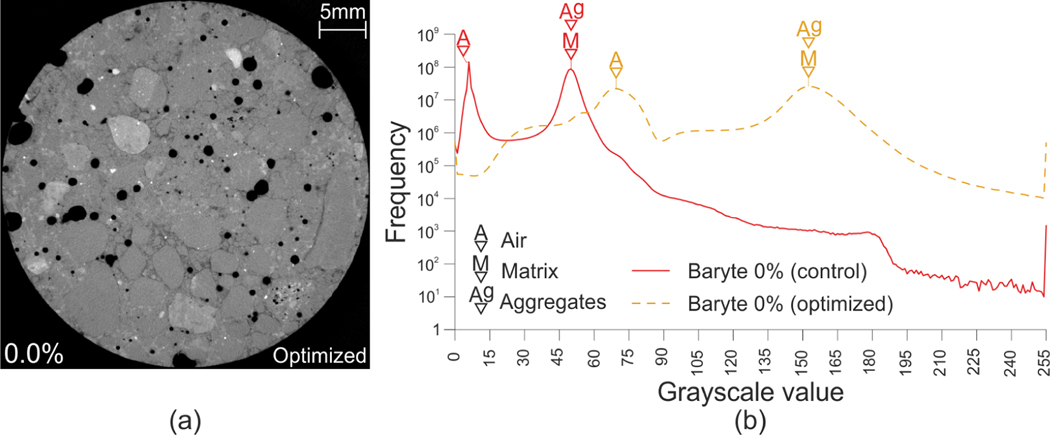
Fig. 11:
Results obtained for the control mix optimizing the CT scan parameters for the analyzed sample (X-ray source voltage and current of 130 kV and 270 μA and 1000 images are used). (a) CT attenuation images and (b) GSV histogram compared to the one obtained with the settings in Tab. 5.

