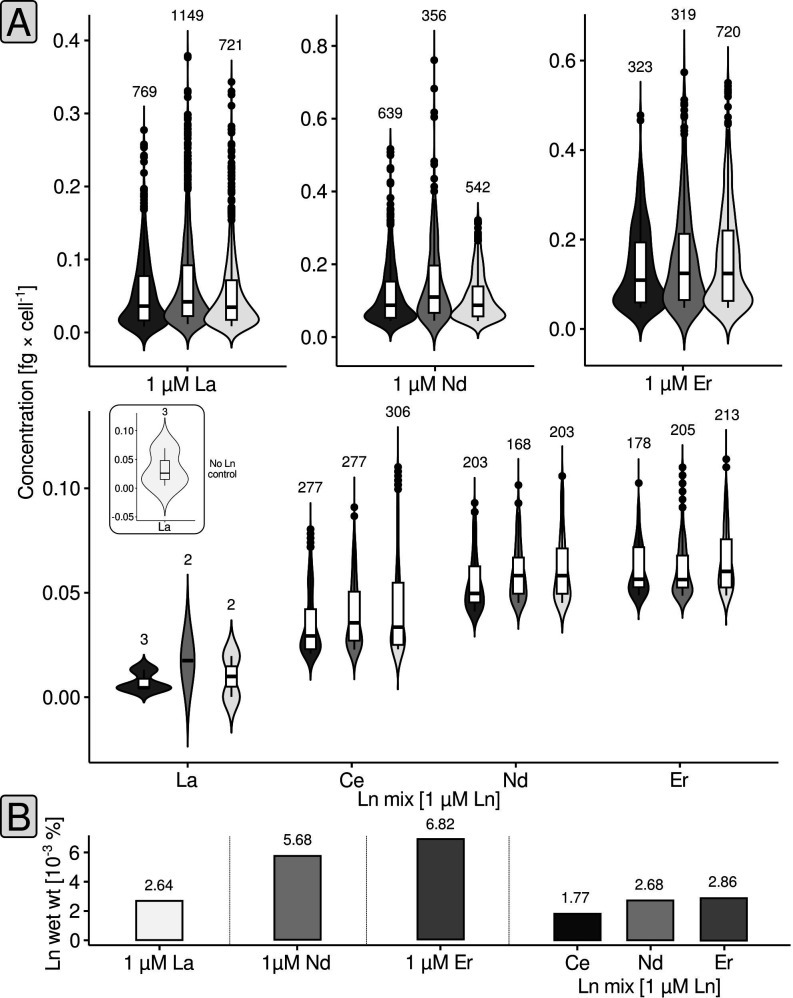
Fig 3.
Single-cell elemental analysis. The Ln concentration per cell is shown through combined violin and box plots (A). The different shades of gray indicate biological replicates (n = 3). The box plots indicate lower and upper quartiles, as well as median values. Black circles represent cells with concentrations above (or below) the whisker limits. The numbers above the violin plots indicate the number of considered events (= cells). The small subpanel shows the results of the control sample without any added Ln. Sporadically detected La events in the case of the control, and Ln mix samples represent background noise of the measurement. The %Ln of the wet weight (B) was calculated as outlined in Materials and Methods.

