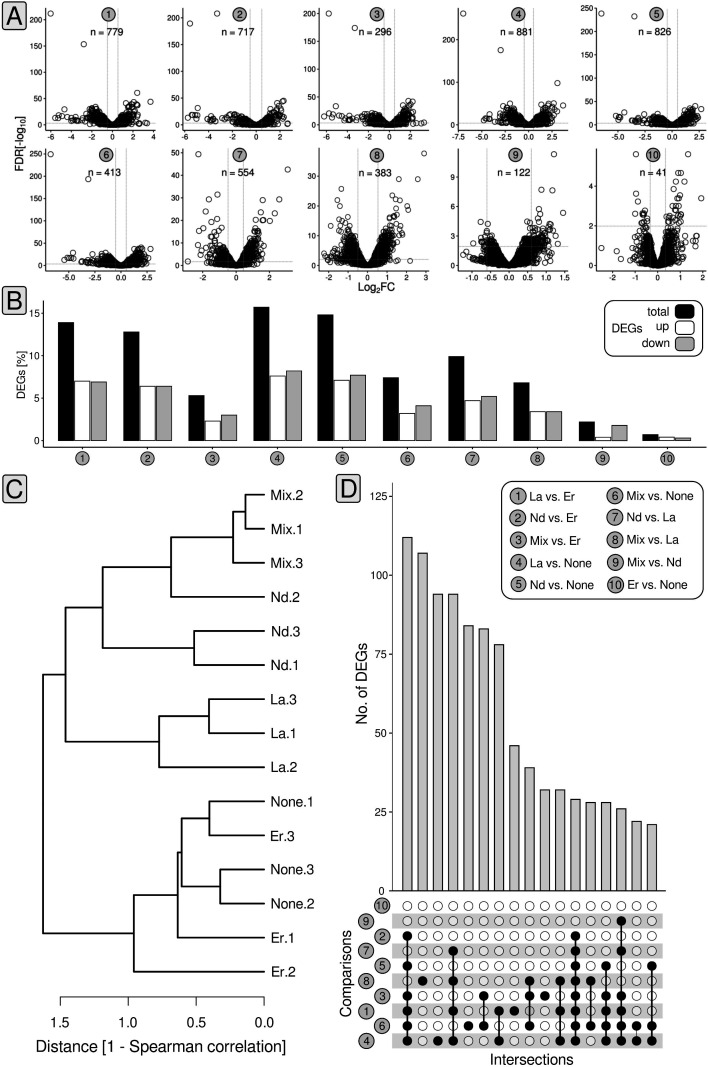
Fig 4.
Statistics and summary of gene expression analysis. Volcano plots summarize the number of differentially expressed genes (DEGs) and the breadth of observed fold changes for the different comparisons (1–10). We defined differential gene expression based on changes in expression (> |0.58| log2FC [fold change]), relative gene expression (> 4 log2[counts per million [CPM]), and FDR-corrected P-values (<0.5). Gray dashed lines indicate the log2FC threshold of |0.58| (A). The proportion of DEGs was summarized as bar charts. The color code refers to the proportion of differentially expressed (black), upregulated (white), and downregulated genes (gray) (B). Based on the counts per million (CPM) matrix, inter-sample relationships have been determined by calculating Spearman distances (C). Shared genes between the different comparisons were highlighted using UpSet plots (D).

