

Abstract
A performance evaluation of superconducting transition-edge sensors (TESs) in the environment of a pion beam line at a particle accelerator is presented. Averaged across the 209 functioning sensors in the array, the achieved energy resolution is 5.2 eV FWHM at Co Kα (6.9 keV) when the pion beam is off and 7.3 eV at a beam rate of 1.45 MHz. Absolute energy uncertainty of ±0.04 eV is demonstrated for Fe Kα (6.4 keV) with in-situ energy calibration obtained from other nearby known X-ray lines. To achieve this small uncertainty, it is essential to consider the non-Gaussian energy response of the TESs and thermal cross-talk pile-up effects due to charged particle hits in the silicon substrate of the TES array.
Keywords: Transition-edge sensor, Hadronic atom, X-ray spectroscopy, X-ray energy calibration, X-ray response, Low-energy tail
1. Introduction
Recently, superconducting transition-edge sensors (TESs) have achieved eV-scale energy resolution in hard X-ray spectroscopy [1,2]. Due to its combination of energy resolution and collecting efficiency, an array of TESs is a powerful tool to determine the central energy and width of a low-intensity characteristic X-ray line. TES arrays are thus well-matched to the precision measurement of the strong-interaction shift and width of X-ray lines produced by hadronic atoms.
A hadronic atom is a Coulomb-bound system of a negatively charged hadron (e.g., π−, K−, , Σ−, Ξ−), electrons, and a nucleus, enabling study of the fundamental strong nuclear force in the low-energy limit. In such a system, the increase in the reduced mass of the atom shifts all X-ray transitions from their standard-atomic values to much higher energies (e.g., keV X-rays for light atoms). A hadronic atom is created by stopping a hadron beam in a target. The slowed (non-relativistic) hadron is captured into a highly excited state and then cascades down to lower energy states via Auger and radiative processes. Finally, the hadron is absorbed by the nucleus in a process mediated by the strong force. The effects of the strong interaction appear in the lowest orbital as an energy shift from the electromagnetic energy level and a broadening due to the absorption [3]. The shift and width are unique probes of the strong interaction.
TES-based kaonic-atom X-ray spectroscopy will explore the strong interaction of the K− with various nuclei. The depth of the “optical potential” that defines the K−-nucleus interaction is still not determined due to the lack of precision in spectroscopic results. Presently, both the ‘deep-potential’ phenomenological approach [3,4] and the ‘shallow-potential’ chiral-unitary model [5] can explain the measured kaonic-atom strong-interaction shifts and widths. To solve the ‘deep or shallow problem,’ precision of ±0.2 eV or better is required for the measurement of the kaonic helium 3d–2p X-ray energy (6.4 keV). The current best precision for the strong-interaction shift measurements of this line is ±2 eV [6].
To prove the viability of the TES-based measurement technique and to evaluate the performance of TESs in the charged particle environment of an accelerator beam line, we performed a demonstration experiment at the πM1 pion beam line at the Paul Scherrer Institute (PSI; Villigen, Switzerland).
2. Demonstration Experiment at the PSI πM1 Beam Line
Figure 1 shows the experimental setup at the PSI πM1 beam line. Incident 170 MeV/c pions are slowed down in carbon moderators, and stopped in a carbon sample target. Pionic-carbon (π-12C) X-rays are detected by the TES spectrometer. To provide calibration X-rays constantly, Bremsstrahlung emission from an X-ray tube induces fluorescence in high purity Cr and Co foil targets. These fluorescence X-rays pass through a hole in the carbon sample target, allowing in-situ energy calibration of the TESs during the measurements. The X-rays enter through the cryostat’s vacuum window (150-μm thick Be) and pass through three layers of IR-blocking filters (each 5-μm thick Al) at three temperature stages (50 K, 3 K, and 50 mK) before reaching the 240-pixel TES array [7]. Each TES consists of a superconducting bilayer of thin Mo and Cu films with an additional 4-μm thick Bi absorber (~80% absorption efficiency for 6.4 keV X-rays), and has an active area of 320 μm × 305 μm set by a gold-coated Si collimator placed in front of the array, and thus the total active area of the array is about 23 mm2. The TES array is cooled with a pulse-tube-backed adiabatic demagnetization refrigerator (ADR) [8]. The ADR’s bath temperature is regulated to 75 mK ±7 μK (r.m.s). The TES pixels are then electrically biased to their superconducting critical temperature of TC ~ 100 mK. The TESs’ time-division-multiplexing readout system samples the current signal of the 240 sensors through 8 SQUID columns [9,10]. The effective sampling rate of each detector is 104 kHz. The recorded number of samples is 1024 (= 9.83 ms) for each X-ray pulse.
Fig. 1.
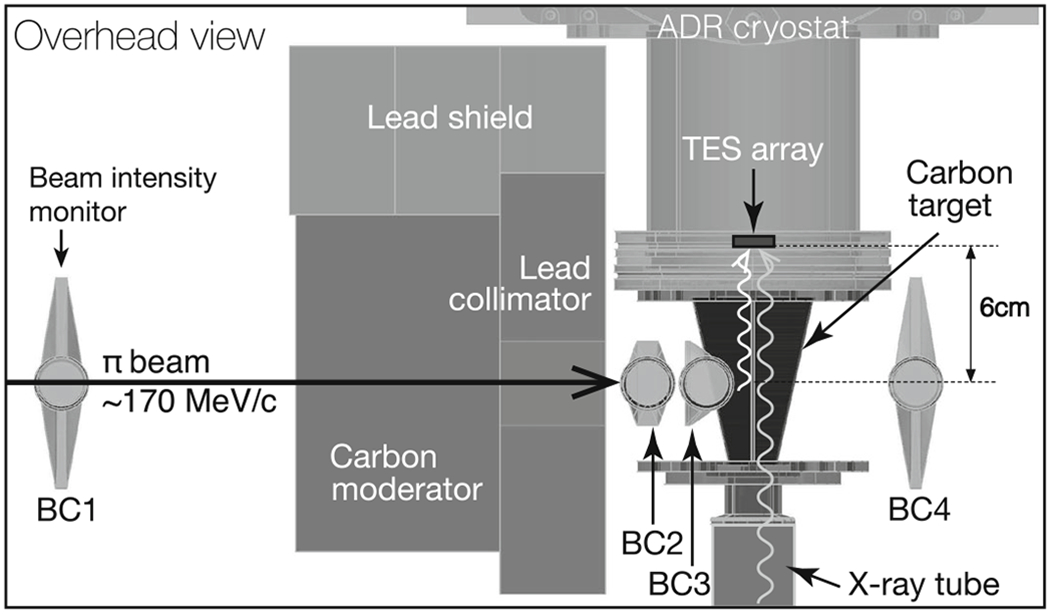
Overhead view of the setup for the π-12C X-ray measurement at the PSI πM1 beam line. The BCs are beam-line counters made with plastic scintillators and photo multiplier tubes to trigger the stopped pions. The distance from the TES array to the beam center is 6 cm
3. Energy Calibration
The X-ray pulse height is calculated with the optimal filter technique [11]. The optimal filter is constructed from the average pulse shape and the noise power spectral density. The pulse height and energy relation of each sensor is determined with Cr Kα, Cr Kβ, Co Kα, and Co Kβ lines. The peak positions of pulse height histogram are fixed at the known energies from Hölzer et al. [12], and then a cubic-spline interpolation curve is formed in the energy region of interest. Figure 2 shows an X-ray energy spectrum measured with the TESs installed at the πM1 beam line with the pion beam off. The lower-intensity X-ray lines, Fe Kα (6.4 keV) and Cu Kα (8.0 keV), originate from the stainless-steel fittings that surround the detector and the Cu base of the detector package, respectively. The energy resolution of combined functioning 209 sensors is 5.2 eV FWHM at Co Kα at a count rate of 4.4 Hz/pixel.
Fig. 2.

The calibration X-ray energy spectrum summed over 209 pixels with the pion beam off. The Cr and Co fluorescence lines provide the energy calibration. The lower-intensity X-ray lines, Fe Kα (6.4 keV) and Cu Kα (8.0 keV), are backgrounds from surrounding metal parts and can be used to verify the energy calibration. The achieved energy resolution is 5.2 eV FWHM at Co Kα at a count rate of 4.4 Hz/pixel
The response function of the TESs must be well understood for accurate energy calibration. A clear non-Gaussian response is observed in the spectrum, and is empirically represented as a low-energy (LE) tail function, the convolution of an exponential and a Gaussian:
| (1) |
where E0 is the X-ray energy, σ is the Gaussian sigma, β is the slope parameter of the exponential, and A is the intensity factor which also defines the tail fraction. Erfc is the complementary error function. The physical source of this LE tail is not fully understood at this time. Preliminary evidence suggests, it originates in the thermally evaporated Bi absorbers. The grain structure of Bi may trap the heat in its lattice with a thermal decay time that is much longer than the thermal response time of the TES itself. The LE-tail function is well fitted as shown in Fig. 3a. The LE-tail fraction is 16.5% for Co Kα and β is 30.0 eV. Fitting with vs. without the LE tail results in a shift in the peak position of 0.5 eV, so inclusion of the tail is critical to reach the precision of ±0.2 eV required for this experiment and future kaonic-atom spectroscopy. The LE-tail fraction for several elements is measured as shown in Fig. 3b. It increases linearly with the X-ray energy. This relation constrains the LE-tail fraction in lines that are too dim to allow the tail fraction to be measured directly.
Fig. 3.

a Co Kα spectrum with the pion beam off. The green curve shows the fit with the LE tail; its residual is shown at bottom with ±3σ curves. The fit range is selected to avoid the Co Kα3 and Kα4 satellite peaks. The red curve shows the fit without considering the LE tail. The broken curve shows the intrinsic line shape from Hölzer et al. [12]. b The measured low-energy tail fraction for several elements with statistical errors (some error bars are too small to see). The tail fractions of Mn, Cu, Ga, Ge, As, Se, and Br are measured with another calibration target (Color figure online)
The pion-beam-on spectrum of Co Kα has additional low-energy and high-energy (HE) components as shown in Fig. 4a. In addition, Fig. 4b shows the degradation in the Gaussian component of the energy resolution as a function of beam rate (particles per second). These beam-correlated effects are explained by the pile-up of thermal cross-talk pulses. When a high-energy charged particle penetrates the 275-μm thick Si substrate of the TES array, about 100 keV of energy is deposited. This energy thermalizes rapidly and heats the entire array, and in so doing, creates cross-talk pulses in all TESs. Typical optimal filtering for a piled-up pulse gives a poor estimation of the X-ray energy, because the piled-up pulse shape does not match the average pulse shape. The estimated energy can shift lower or higher depending on where in time the cross-talk pulse coincides relative to the X-ray pulse. Some of piled-up events are identified and cut, which does yield a moderate improvement in the measured spectrum. Though, it is difficult to distinguish the piled-up pulses close to each other in time. Therefore, an additional HE-tail function same as Eq. (1) is required to fit the spectrum with the pion beam on. The fitted HE-tail fraction is 8.3%.
Fig. 4.
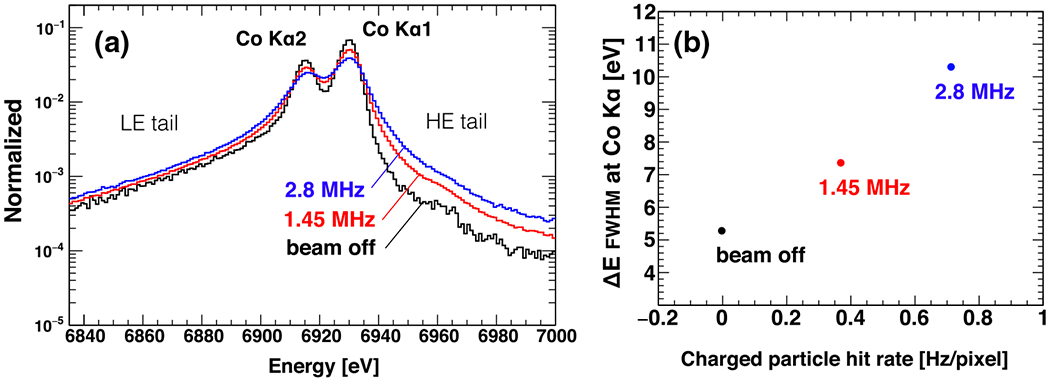
a Spectra of Co Kα X-rays with different pion beam rates (particles per second). The black is beam off, the red is 1.45 MHz, and the blue is 2.8 MHz. b Degradation in the Gaussian energy resolution as a function of the pion beam rate (Color figure online)
4. Absolute Energy Determination
The background Fe Kα X-rays provide a useful test of the energy calibration very near the energy of the π-12C line of interest. Figure 5 shows the measured X-ray spectrum of the Fe Kα and the π-12C 4–3 transitions (to be discussed in a Letter) with 209 TES pixels at the 1.45 MHz beam rate. The in-situ energy calibration is re-calculated every 2 hours to mitigate gain drift of TESs. The absolute energy of Fe Kα is consistent with the value of Hölzer et al. [12] within ±0.03 eV statistical error σstat and ±0.03 eV systematic uncertainty σsyst. The main uncertainty source is the ambiguity of LE-tail (absorber and thermal cross-talk origins) and HE-tail parameters as interpolated from the fit values for Cr Kα and Co Kα (±0.02 eV). The total estimated uncertainty of the absolute energy is ±0.04 eV (). This precision is about 10 times better than the measurement technique with silicon drift detectors [6], and meets our precision goal for the future measurement of kaonic helium 3d–2p X-ray energy.
Fig. 5.

The measured X-ray spectrum of Fe Kα and the π-12C 4–3 transitions summed over 209 pixels at the 1.45 MHz beam rate. The green curve shows the fitting to the summed spectrum and a linear background. The blue curve is the component of the fit due to only the Fe Kα X-rays with LE and HE tails, and the red curves are due to the individual π-12C lines with tails. The energy resolution is 6.8 eV FWHM with the pion beam on (Color figure online)
5. Conclusion
We have evaluated the performance of a 240-pixel TES array at the PSI πM1 beam line, and achieved absolute energy uncertainty of ±0.04 eV for Fe Kα in the charged particle beam environment. Charged particle impacts on the TES array are investigated for the first time: the piled-up thermal cross-talk pulses degrade the Gaussian energy resolution and create low-energy and high-energy tails in the X-ray spectrum. Even in the absence of the charged particle beam, the TES energy response also shows a LE tail, which could be caused by the grain structure of the Bi absorber. While these LE and HE tails add complexity to the analysis of the data, they do not prevent the TESs from achieving absolute energy calibration at a level necessary for TES-based kaoinic-atom spectroscopy to solve the K−-nucleus potential depth problem. In future experiments, better shielding will limit the LE and HE tails from charged particle hits, and the LE-tail response will be eliminated via a different absorber fabrication process.
Acknowledgments
We thank K. Deiters and the PSI staff for the support and the beam-line coordination and operation. We thank as well the members in the NIST Quantum Sensors Project for the efforts and discussions to realize this challenging application. This work was partly supported by the Grants-in-Aid for Scientific Research from MEXT and JSPS (Nos. 25105514, 26707014, 24105003, and 15H05438), the strategic young researcher overseas visits program for accelerating brain circulation by JSPS (No. R2509), and the NIST Innovations in Measurement Science Program. Submission of an agency of the U.S. Government; not subject to copyright.
References
- 1.Ullom JN, Beall JA, Doriese WB, Duncan WD, Ferreira L, Hilton GC, Irwin KD, Reintsema CD, Vale LR, Appl. Phys. Lett 87, 194103 (2005). doi: 10.1063/1.2061865 [DOI] [Google Scholar]
- 2.Smith SJ, Adams JS, Bailey CN, Bandler SR, Chervenak JA, Eckart ME, Finkbeiner FM, Kelley RL, Kilbourne CA, Porter FS, Sadleir JE, J. Low. Temp. Phys 167, 168 (2012). doi: 10.1007/s10909-012-0574-y [DOI] [PMC free article] [PubMed] [Google Scholar]
- 3.Batty CJ, Friedman E, Gal A, Phys. Rep 287, 385 (1997). doi: 10.1016/S0370-1573(97)00011-2 [DOI] [Google Scholar]
- 4.Friedman E, Int. J. Mod. Phys. A 26, 468 (2011). doi: 10.1142/S0217751X11051846 [DOI] [Google Scholar]
- 5.Hirenzaki S, Okumura Y, Toki H, Oset E, Ramos A, Phys. Rev. C 61, 055205 (2000). doi: 10.1103/PhysRevC.61.055205 [DOI] [Google Scholar]
- 6.Okada S, Beer G, Bhang H, Cargnelli M, Chiba J, Choi S, Curceanu C, Fukuda Y, Hanaki T, Hayano RS, Iio M, Ishikawa T, Ishimoto S, Ishiwatari T, Itahashi K, Iwai M, Iwasaki M, Juhász B, Kienle P, Marton J, Matsuda Y, Ohnishi H, Outa H, Sato M, Schmid P, Suzuki S, Suzuki T, Tatsuno H, Tomono D, Widmann E, Yamazaki T, Yim H, Zmeskal J, Phys. Lett. B 63, 387 (2012). doi: 10.1016/j.physletb.2007.08.032 [DOI] [Google Scholar]
- 7.Ullom JN, Doriesea WB, Fischera DA, Fowlera JW, Hiltona GC, Jayea C, Reintsemaa CD, Swetza DS, Schmidt DR, Synchrotron Radiat News 27, 24 (2014). doi: 10.1080/08940886.2014.930806 [DOI] [Google Scholar]
- 8.Bennett DA, Horansky RD, Schmidt DR, Hoover AS, Winkler R, Alpert BK, Beall JA, Doriese WB, Fowler JW, Fitzgerald CP, Hilton GC, Irwin KD, Kotsubo V, Mates JAB, O’Neil GC, Rabin MW, Reintsema CD, Schima FJ, Swetz DS, Vale LR, Ullom JN, Rev. Sci. Instrum 83, 093113 (2012). doi: 10.1063/1.4754630 [DOI] [PubMed] [Google Scholar]
- 9.Reintsema CD, Beyer J, Nam SW, Deiker S, Hilton GC, Irwin KD, Martinis J, Ullom JN, Vale LR, Rev. Sci. Instrum 74, 4500 (2003). doi: 10.1063/1.1605259 [DOI] [Google Scholar]
- 10.Reintsema CD, Adams JS, Baker R, Handler SR,Doriese WR,Figueroa-Feliciano E, Hilton GC, Irwin KD, Kelly RL, Kilboume CA, Krinsky JW, Porter FS, Wikus P, AIP Conf. Proc 1185, 237 (2009). doi: 10.1063/1.3292321 [DOI] [Google Scholar]
- 11.Szymkowiak AE, Kelley RL, Moseley SH, Stahle CK, J. Low. Temp. Phys 93,281 (1993). doi: 10.1007/BF00693433 [DOI] [Google Scholar]
- 12.Hölzer G, Fritsch M, Deutsch M, Härtwig J, Förster E, Phys. Rev. A 56, 4554 (1997). doi: 10.1103/PhysRevA.56.4554 [DOI] [Google Scholar]