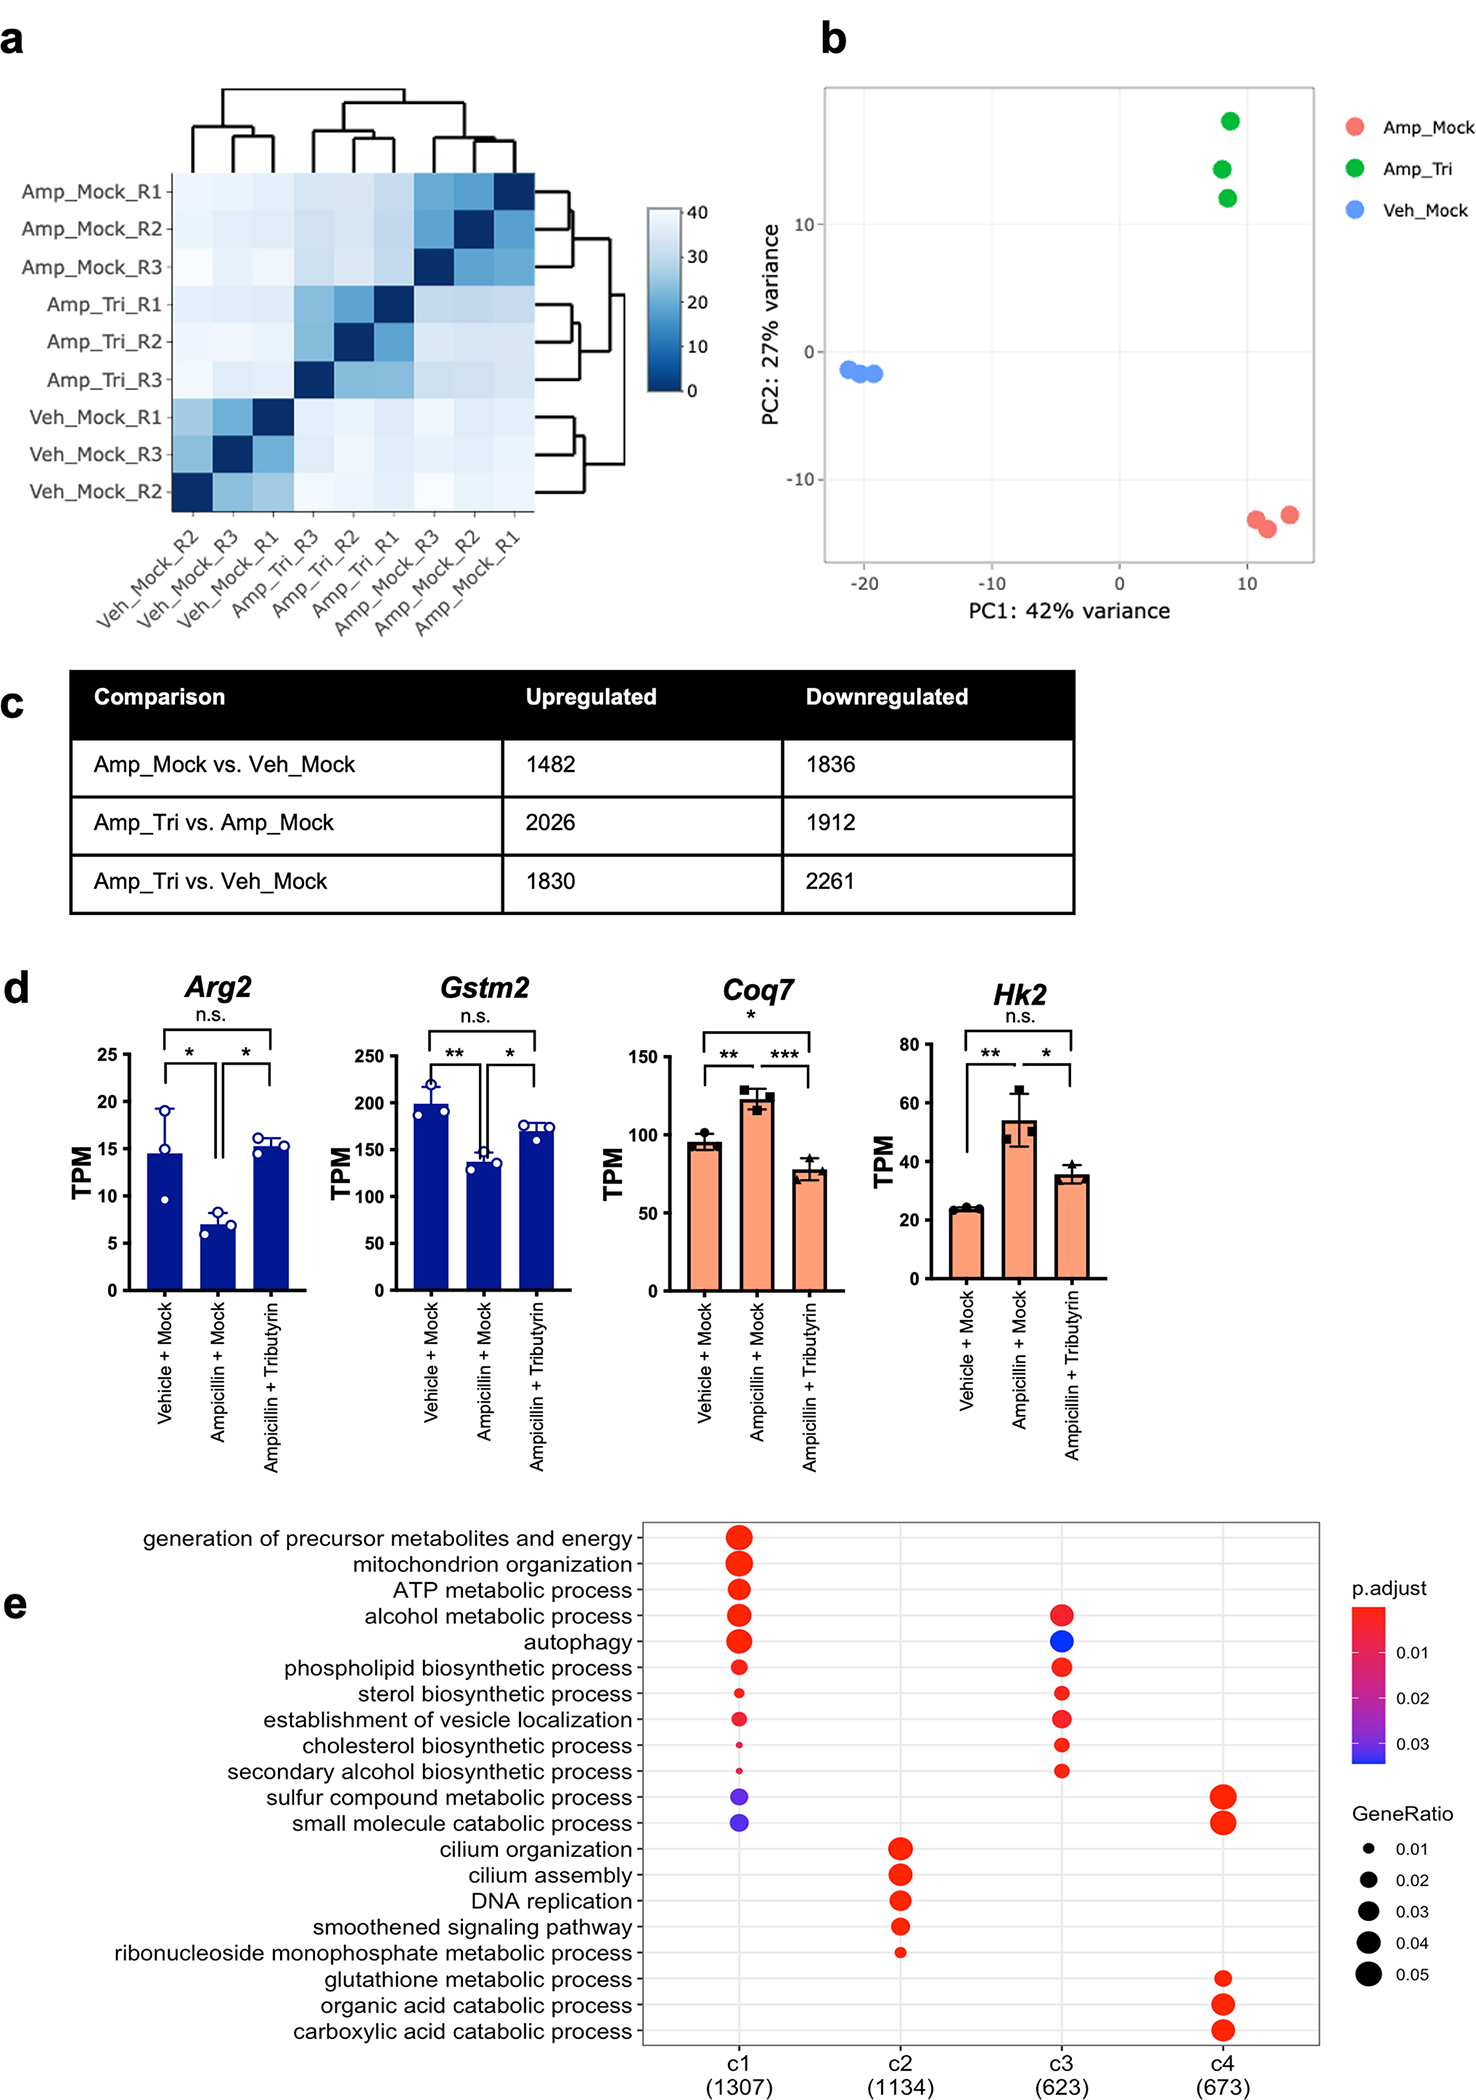
Extended Data Fig. 6: Supplemental RNA-seq data.

C57BL/6J female mice were divided into three different groups (n = 3 biologically independent animals per group): vehicle treated and mock gavaged (Veh_Mock), Ampicillin treated and mock gavaged (Amp_Mock), and Ampicillin treated with tributyrin gavage (Amp_Tri). Cecal IECs were isolated for RNA sequencing. (A) Heatmap of correlation between samples. Pearson correlation was performed of gene expression measurements across samples using DEseq2. (B) Principal component analysis of RNA-seq samples. (C) Table of significant differential gene expression across groups. Gene expression changes were identified using DEseq2 and p-values less than 0.05 were considered significant. The Wald test was used as part of the DESeq2 package for differential gene analysis, along with multiple testing correction using Benjamini-Hochberg false discovery rate to get the padj value. (D) Visualization of expression of select genes in clusters 1 (blue) and 4 (red). Graphs display mean and standard error. * p-value = < 0.05, ** p-value = < 0.01, *** p-value = < 0.001 by one-way ANOVA and adjusted for multiple comparisons. (E) Gene ontology analysis of all clusters of differential gene expression. Over Representation Analysis was performed using a one-sided version of Fisher’s exact test in the clusterProfiler package.
