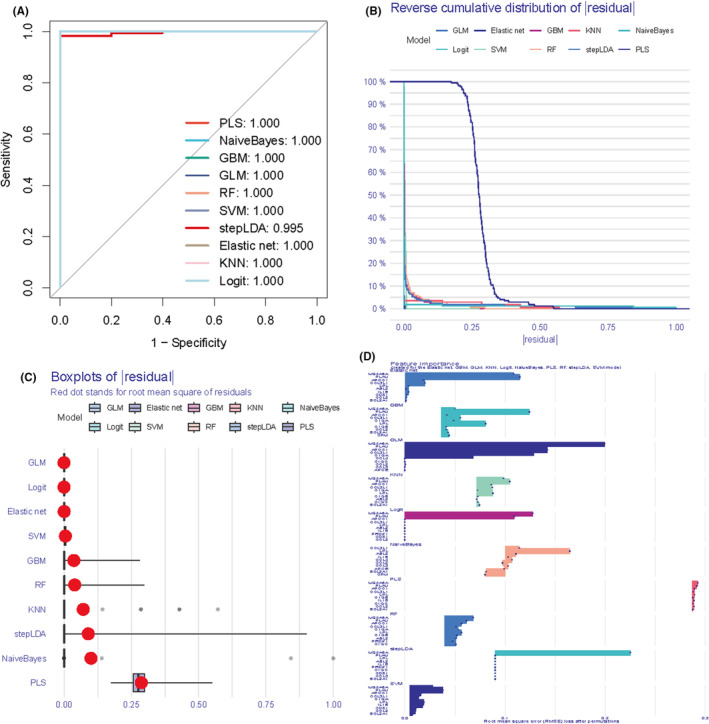
FIGURE 4.

Evaluation of different machine learning. (A) ROC curves to assess binary classifier performance. the closer the ROC curve is to the upper left corner, the better the performance of the model. (B) Inverse cumulative distribution plot of residuals for the sample. (C) Residual boxplot showing the median, interquartile range and outliers of the residuals. (D) Top ten genes for each model importance.
