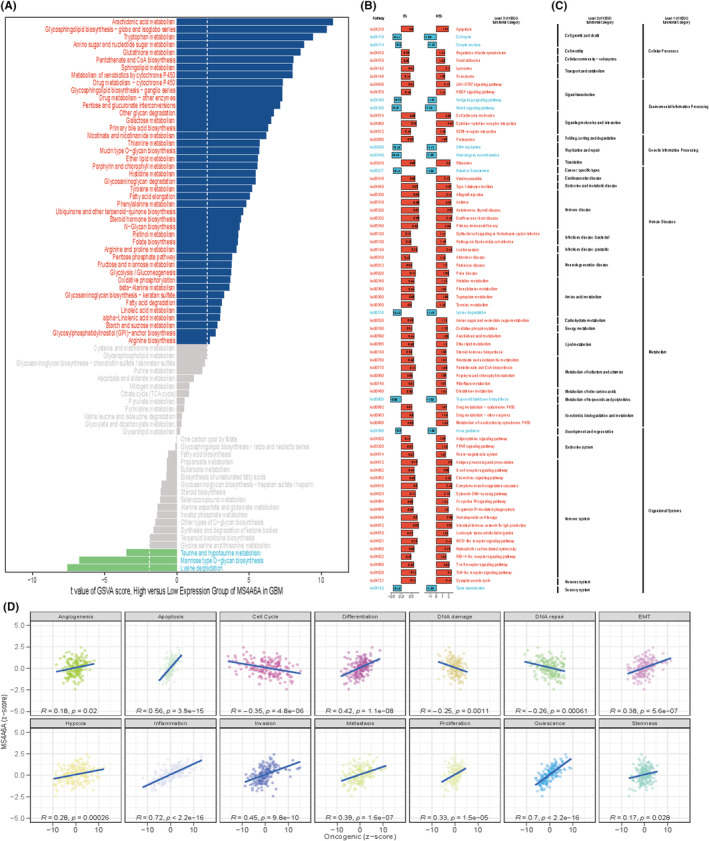
FIGURE 6.

Biological function of MS4A6A. (A) Differences in metabolic gene sets between the high and low groups. x‐axis is the t‐value of GSVA scores. (B) Enrichment analysis results for the high and low expression groups. (C) Horizontal coordinates are scores for each functional state, (D) vertical coordinates are MS4A6A expression and R is pearson correlation analysis.
