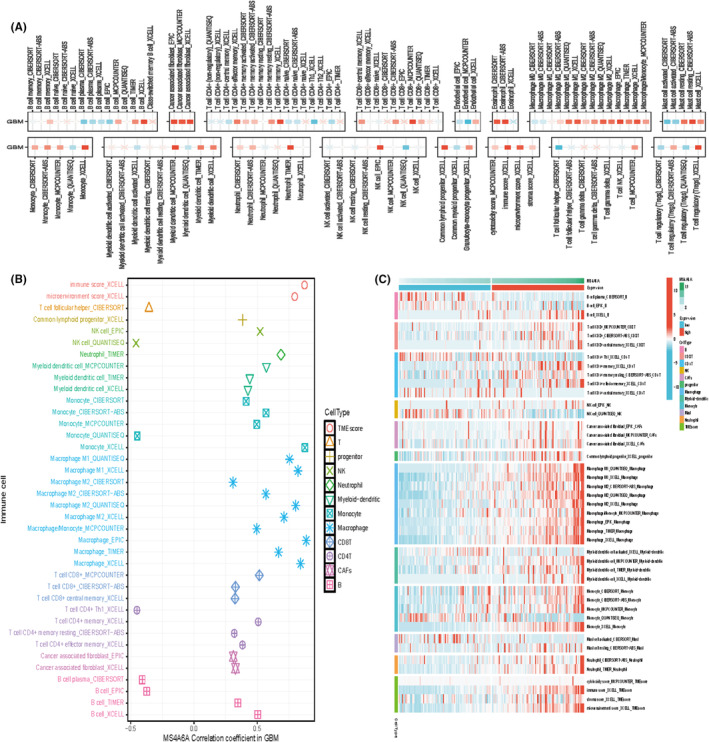
FIGURE 8.

Relationship between MS4A6A and immune cells (A, B) Multiple algorithms to assess the Spearman correlation of MS4A6A expression with different immune‐infiltrating cells in GBM. The colour of the squares reflects the correlation coefficient (p < 0.05), with the redder colour representing the value closer to 1 (positive correlation) and the bluer colour representing the value closer to −1 (negative correlation). (C) Immune cell infiltration in the high and low expression groups.
