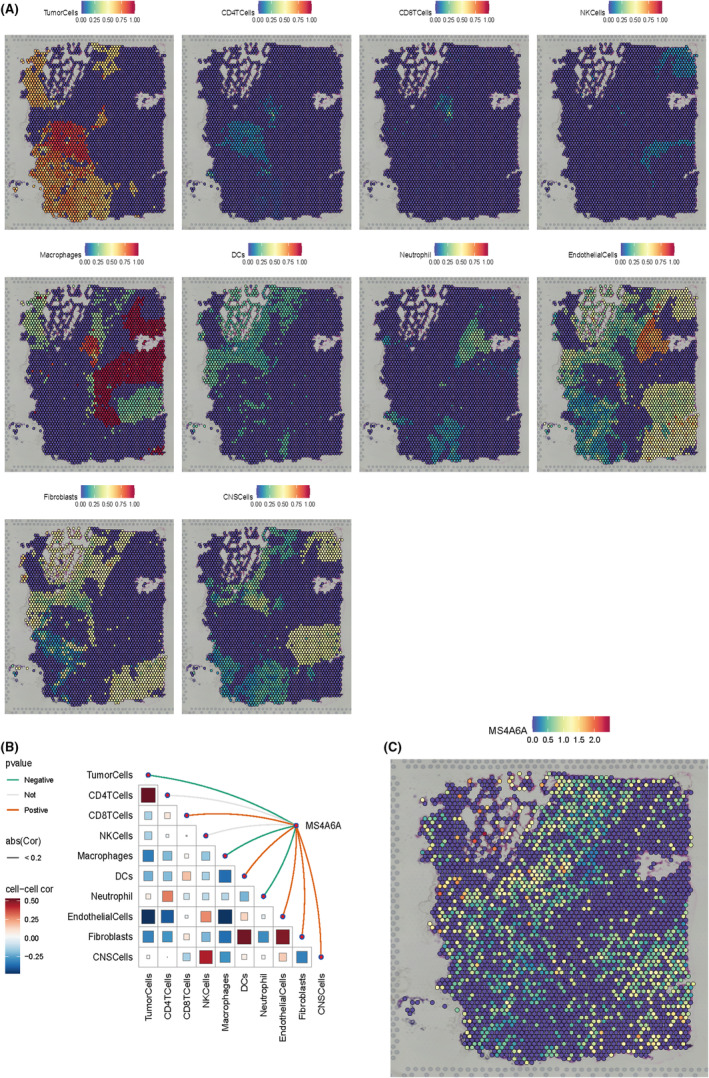
FIGURE 10.

Spatial transcriptomic analysis. (A)MS4A6A expression in various immune cells such as Tumour Cells, CD4 T Cells, CD8 T Cells, NK Cells, Macrophages, DCs, Neutrophils, Endothelial Cells, Fibroblasts and CNS Cells. Each dot is a microregion (spot) of spatial transcriptome sequencing, darker colour (red) means higher expression of that gene in the spot. (B) Spearman correlation analysis was performed to calculate the correlation between cellular content and cellular content, as well as the correlation between cellular content and gene expression in all spots. Red lines represent positive correlations, green lines represent negative correlations, grey lines represent no significance and the thickness of the line represents the absolute magnitude of the correlation coefficient. The correlation of the triangular region is indicated by the colour shade and size of the squares. (C) Expression of MS4A6A.
