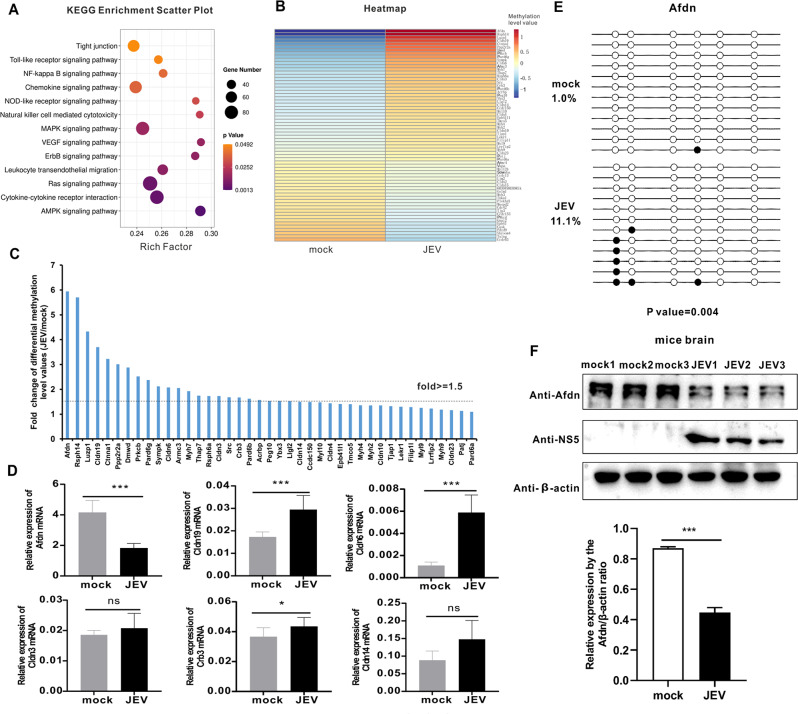
Fig. 5.
KEGG analysis reveals that JEV infection modulates tight junction signaling by hypermethylation of the Afdn promoter. (A) KEGG pathway analysis of DMGs in upstream2k region. The ordinate represents the enriched pathways, and the abscissa represents the Rich factor of the correspond- ding pathways; the size of the spots represents the number of genes related to DMRs enriched in each pathway. (B) Heatmap analysis of methylation levels of DMGs in the tight junction signaling pathway. (C) Tight junction signaling pathway-related hypermethylated DMGs methylation levels from WGBS-seq. X-axis represents hypermethylated DMGs. The Y-axis represents the fold difference of the methylation level value of the JEV group divided by the methylation level value of the mock group. Among them, those above the dotted line indicate that the multiple of the differential methylation level value of the two groups is greater than 1.5 times. (D) qPCR was performed to verify some hypermethylated DMGs with differential methylation levels greater than 1.5 times. Y axis represents the relative expression of GAPDH (100%). (E) BSP was performed to test Afdn genes’ methylation levels using JEV-infected mouse brain DNA samples. Each circle represents a CG site, with the white circles representing unmethylation and the black circles representing methylation. (F) Western blot measures the expression of AFDN after JEV infection. The histogram below shows a densitometric analysis of the Western blot results. Data are reported as mean values ± standard deviations (SD) of three independent experiments with three biological replicates. The significance of differences between groups was evaluated using the Student’s t-test. Statistical significance was established at *p < 0.05, **p < 0.01, and ***p < 0.001, ns: not significant

