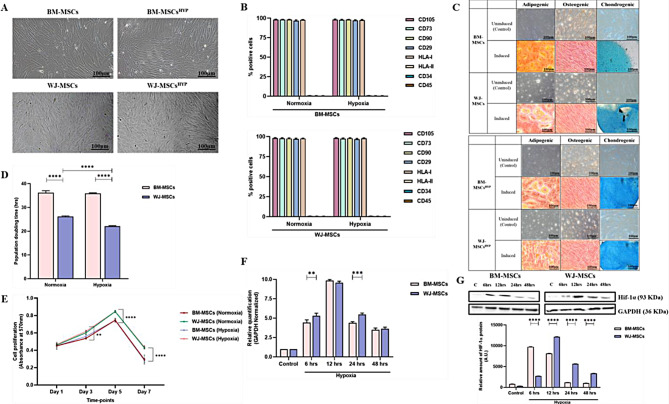
Fig. 1.
Characterization of human MSCs (BM-MSCs, BM-MSCsHYP, WJ-MSCs, and WJ-MSCsHYP) (A) Morphological images. (B) A bar graph depicts surface marker profiling using flow cytometry. (C) Trilineage differentiation into adipocytes (28 days of induction), osteocytes (21 days of induction), and chondrocytes (14 days of induction). (D) The bar graph represents the population doubling time in hours. (E) The line diagram represents the growth kinetics. (F) The bar graph depicts the relative expression of the HIF-1α gene using qPCR before and after exposure to 1% O2 at various time intervals (6 h, 12 h, 24 h, 48 h). (G) Western blot images represent the expression of Hif-1α protein and the bar graph represents the relative expression of Hif-1α protein before and after exposure to 1% O2 at various time intervals (6 h, 12 h, 24 h, 48 h). Full-length blots are presented in Supplementary Figure S9. Data are shown as Mean ± S.D. The data shown are from independent experiments performed with MSCs derived from three different donors (biological replicates) and conducted in triplicates (technical replicates)
Statistical analysis: Tukey’s multiple comparisons test; ***≤0.001; ****≤0.0001. All experiments were done in triplicates. Scale bar: 10X = 100 μm. Abbreviations: BM: Bone marrow; WJ: Wharton’s Jelly; MSCs: Mesenchymal stem cells; HYP: Hypoxia-preconditioned

