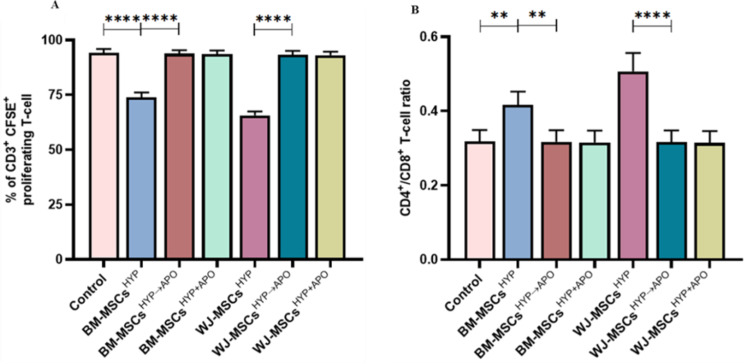
Fig. 3.
Effect of hypoxia-preconditioned MSCs (MSCsHYP, MSCsHYP→APO, MSCsHYP+APO) on the proliferation of aGVHD patients derived T cells. The bar graph represents (A) the percentage of CD3+ CFSE+ proliferating T cells (n = 5). (B) the ratio of CD4+/CD8+ T cells (n = 5) in the direct co-culture of MSCs and T cells. Data shown represent the Mean ± S.D of 5 independent experiments performed with PBMNCs derived from 5 different donors (biological replicates), with each experiment conducted in triplicate (technical replicates). Statistical analysis: Tukey’s multiple comparisons test; **≤0.01; ****≤0.0001. Abbreviations: BM: Bone marrow; WJ: Wharton’s Jelly; MSCs: Mesenchymal Stem Cells; HYP: Hypoxia-preconditioned; APO: Apoptosis

