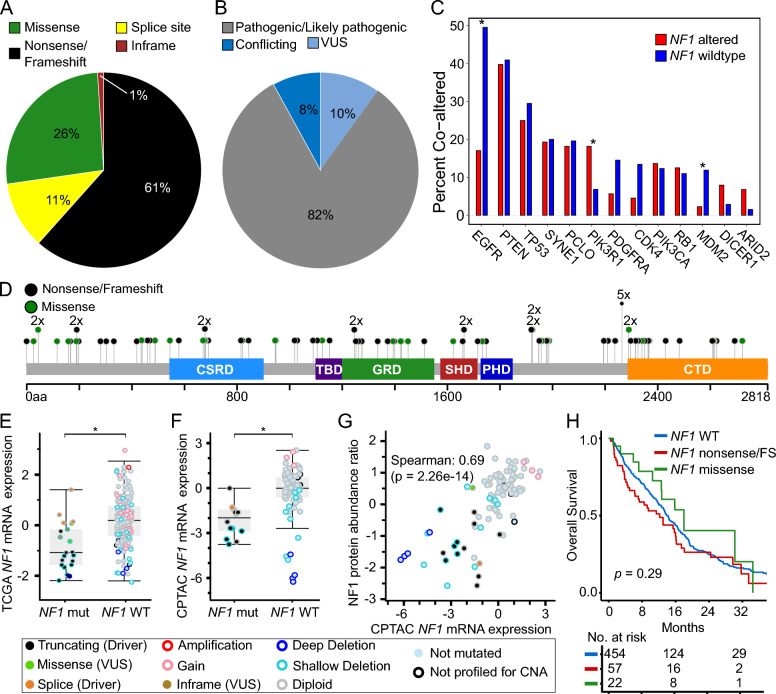
Fig. 1.
Genomic and clinical features of NF1 loss in glioblastoma. A Distribution of NF1 alteration types and B ClinVar classification of NF1 alterations detected in JHH GBM cohort (N = 115). C Co-alteration frequencies between NF1 and other selected genes in JHH GBM cohort. Statistical significance was assessed using two-tailed Fisher’s Exact test. D Lollipop plot of NF1 alterations detected in JHH GBM cohort. Box and whisker plots comparing NF1 mRNA expression between NF1 mutant and NF1 wildtype glioblastomas in E TCGA (z-scores, U133 microarray) and F CPTAC (z-scores, log2FPKM) GBM cohorts. Statistical significance was assessed using Welch’s t-test. G Scatter plot comparing NF1 protein abundance ratio (z-scores) and NF1 mRNA expression (z-scores, log2FPKM) in CPTAC GBM cohort. H Kaplan–Meier survival curves displaying overall survival in JHH GBM cohort stratified by NF1 alteration type. VUS = variant of unknown significance, FS = frame shift

