Figure 1.
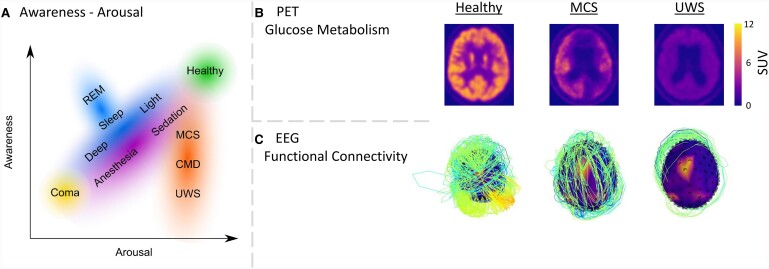
The arousal-awareness axes of consciousness and examples of metabolic and functional connectivity in patients with disorders of consciousness. (A) Graphical depiction of states of consciousness alongside the dimensions of arousal and awareness including healthy awake consciousness, different states of sleep (light, deep, REM), a scale from sedation to anaesthesia, and the DoC states of the minimally conscious state (MCS), the unresponsive wakefulness syndrome (UWS) and Cognitive Motor Dissociation (CMD). Note that these states exist on continuous scales. (B) Transversal view of the standardized uptake value of the brain collected with glucose positron emission tomography (fluorodeoxyglucose/FDG-PET) (see the study by Thibaut et al.5 for details about data processing). The glucose uptake values range from 1 to 12 where higher values are associated with more glucose consumption, as observed in a healthy brain. (C) Scalp mesh with electroencephalogram (EEG) electrode locations indicated as black dots. Lines between electrodes depict the connectivity between functionally connected electrodes. Functional connectivity was determined by the weighted phase lag index6 on preprocessed data (see the study by Thibaut et al.5 for details about the pre-processing). For clarity, the top 5 strongest outgoing connections per electrode are shown. Strength of the connection is represented by the height of the line (i.e. weak connections are low and yellow, and strong connections are high and red). Access to interactive figures that allow for deeper investigation into the concepts illustrated here can be found in the Supplementary material.

