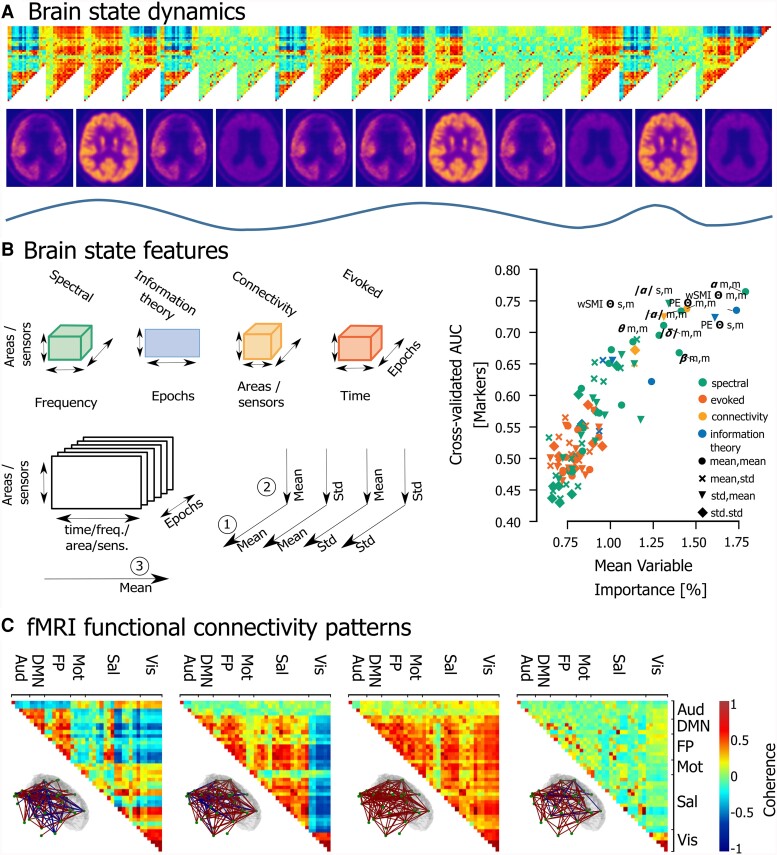
Figure 3.
Methods for identification and characterization of brain state dynamics illustrated through fMRI connectivity patterns. (A) Illustration of the multi-modal dynamics of brain states showing how they can change with different timescales, while also displaying recurrences in a repertoire. The top shows an illustration of how brain states can be quantified (e.g. from bottom to top: through oscillatory EEG of fMRI activity, glucose metabolism or functional connectivity between regions) and how brain states fluctuate over time. For illustrator purposes, data was taken from 1B and 3C, but illustrated dynamics are purely illustrator and not based on real data. (B) The wide range of features that can be used to describe brain states (adapted from the study by Engemann et al.64). The left figure displays these features in different categories, showing which dimensions they take into account, i.e. samples, time, area, frequency (freq.), sensors (sens.), and various ways to summarize them (e.g. mean, standard deviation (std)). The right figure shows how this was applied to EEG data, with the plentitude of features now ordered based on their importance in predicting if a DoC patient is fully unaware (UWS) or has residual awareness (MCS) (see64 for details). This ordering was done based on the cross-validated area under the curve (AUC). This illustrates that multifaceted investigation is important, alongside the need for the selection of the most relevant features for the differentiation between brain states and parallel behavioural state. (C) Patterns of functional connectivity that occur in a quasi-stable manner and alternate dynamically could be considered brain states. Functional connectivity is defined between areas in the auditory network (Aud), default mode network (DMN), fronto-parietal network (FP), motor network (Mot), salience network (Sal), and visual network (Vis) defined as 10-mm-diameter spheres around peak coordinates selected from the literature. The top part shows 4 recurring patterns or brain states (for details on their extraction, see the study by Demertzi et al.3). The bottom shows a representation of the functional connectivity between brain regions for each of these brain states. Positive connections are shown in red and negative ones in blue. The 5% strongest connections are presented. Access to interactive figures that allow for deeper investigation into the concepts illustrated here can be found in the Supplementary material.

