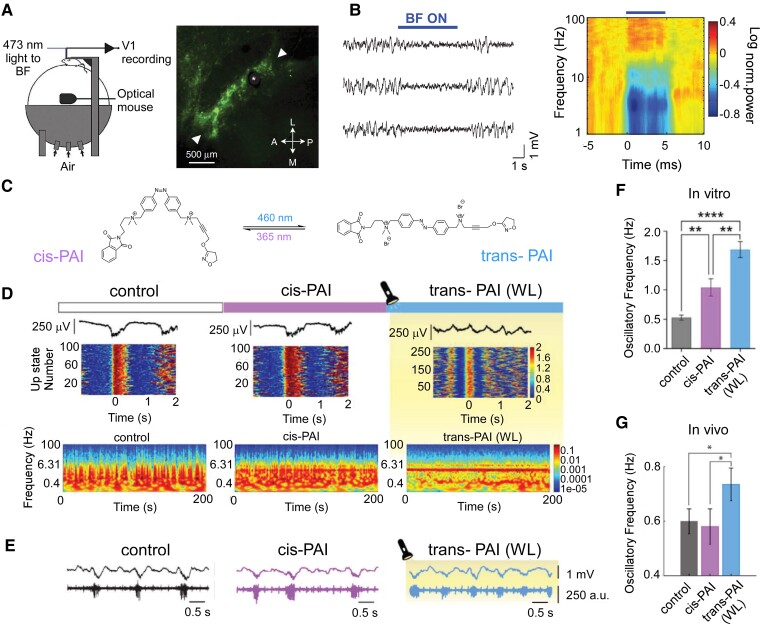
Figure 5.
Pharmacological neuromodulation-induced consciousness state changes in animal models. (A, B) Optogenetic activation of basal forebrain (BF) cholinergic neurones desynchronize cortical activity in awake mice. Light activation of basal forebrain cholinergic neurones reliably desynchronized cortical activity by reducing the power at low frequencies (1–5 Hz) and increasing the power at high frequencies (60–100 Hz). (A) Schematic illustration of experimental setup (left) and fluorescence microscopy image of basal forebrain cholinergic cells expressing channelrhodopsin-2 and enhanced yellow fluorescent protein. Asterisk indicates the position of optic fibre; arrowheads indicate the posterolateral and anteromedial borders of basal forebrain (B) Three example local field potential (LFP) traces show the effect of basal forebrain stimulation (blue bar; average of all experiments in the right panel). Figure modified from the study by Pinto et al.140(C–F) Control of brain state transitions with a photo-switchable muscarinic agonist (Phthalimide-Azo-Iper (PAI)) in vitro and in vivo, and the effect on the brain network is studied. Physiological synchronous emergent cortical activity consisting of slow oscillations is transformed into a higher frequency pattern in the cerebral cortex, both in vitro and in vivo, as a consequence of PAI activation with white light (WL). (C) Chemical structures of trans- and cis-PAI photoisomers are shown. The molecule changes with light its capacity to bind to and/or activate proteins associated with neural signalling, reversibly switching from the straight trans configuration in the dark or under visible light, to the bent cis configuration when UV light is applied. (D) Photocontrol of brain waves in vitro using PAI and direct illumination with white light. Representative LFP traces (top), raster plots of firing rate during the Up-states (middle) and spectrograms (bottom) under control conditions, cis-PAI and trans-PAI after photoconversion with white light (WL). Colour scales are in arbitrary units (a.u.). (E)In vivo photomodulation of brain waves. Representative raw traces of LFP (top, in millivolt (mV)) and multiunit activity (bottom, in arbitrary units (a.u.)), showing the differences in oscillatory frequency and firing rate during the Up-states between the control, cis-PAI, and trans-PAI after photoswitching with WL. (F, G) Changes in oscillatory frequency in vitro (F; mean ± SEM are reported from n = 17 ferret slices, one-way ANOVAs, with Welch test for pairwise comparisons, ** = P < 0.01, *** = P < 0.001) and in vivoG; mean ± SEM are reported from n = 8 mice, one-way repeated-measures ANOVAs, with Fisher’s LSD for pairwise comparisons, * = P < 0.05) by PAI photoisomerization. Comparison of the different conditions analysed in this study: control, cis-PAI and trans-PAI. Figures C–F have been adapted from the study Barbero-Castillo et al.152 Access to interactive figures that allow for deeper investigation into the concepts illustrated here can be found in the Supplementary material.

