Figure 6.
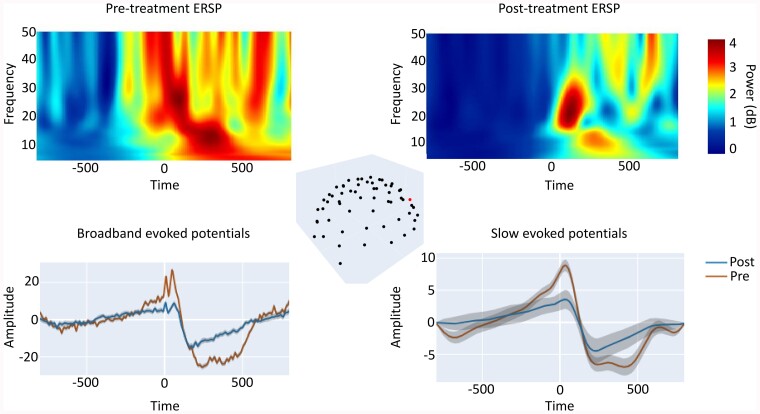
Neurophysiological effects of tDCS over the dorsolateral prefrontal cortex in a patient in the minimally conscious state. EEG data evoked by a transcranial magnetic stimulation (TMS; −800 ms before to 800 ms after, on each x-axis) before and after transcranial direct current stimulation (tDCS) treatment (see the study by Mensen et al.4 for experimental details). The top left figure shows the event-related spectral perturbation (ERSP; frequency on the y-axis, colour indicating increasing power blue->red) pre-treatment while the right figure shows the ERSP post-treatment. A marked decrease in the slow wave induced by the TMS pulse can be observed. The top middle figure displays the electrode configuration, with a red dot indicating the electrode for which the responses are displayed. The bottom figures show the pre-treatment (red) and post-treatment (blue) amplitude response (y-axis) for both the broadband and the filtered (2–6 Hz) signals on the left and right, respectively. Lines display mean responses over all TMS trials, shaded area shows standard deviation. These figures are from a single subject (n = 1) to illustrate that all individuals showed significant differences between pre- and post-tDCS treatment (statistics not reported, but clear from standard deviations). Despite the changes in brain state as a result of this tDCS treatment there seems to be an absence of behavioural effects. Access to interactive figures that allow for deeper investigation into the concepts illustrated here can be found in the Supplementary material.

