
Figure 2.
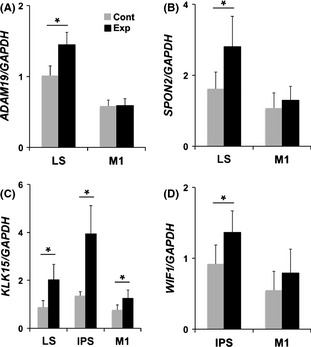
Quantitative analysis of tool use associate candidates by quantitative reverse transcription–polymerase chain reaction (qRT–PCR) (A–D). qRT–PCR was performed with five control and five experimental animals for the lateral sulcus (LS) and M1, and four experimental and four control animals for the intraparietal sulcus (IPS) region. Note that SPON2, ADAM19, and WIF1 in the LS and IPS showed higher expression in experimental animals than control animals, although no significant differences were seen in M1. *P < 0.05.