
Figure 5.
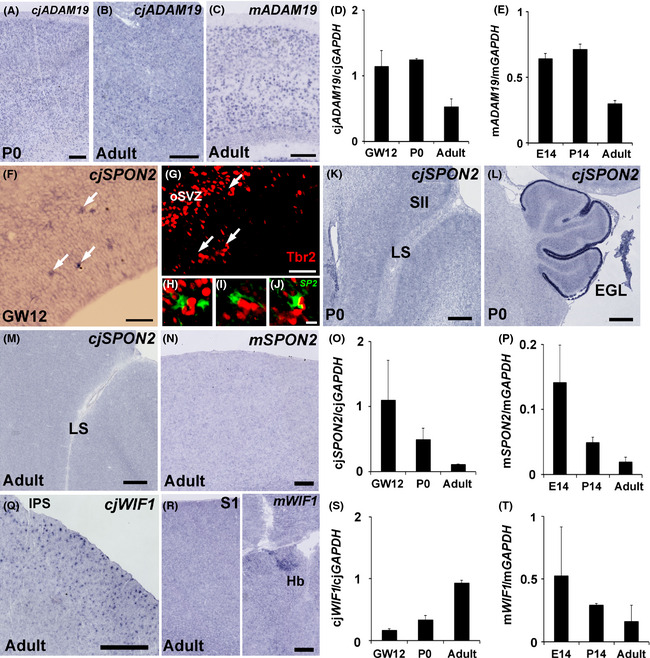
ADAM19, SPON2 and WIF1 expressions in the mouse and marmoset neocortex. Similar ADAM19 expression levels among the macaque, marmoset and mouse (A–E). In situ hybridization for ADAM19 in marmoset (A, B) and mouse (C) somatosensory cortex. Quantitative reverse transcription–polymerase chain reaction (qRT–PCR) analysis of ADAM19 expression in developing marmoset (D) and mouse (E). Differential SPON2 expression between the macaque and the other species (F–P). In situ hybridization for SPON2 in the marmoset (F, K, L, M) and mouse (N). In situ hybridization for SPON2 (F) and subsequent immunostaining with a Tbr2 antibody (G) in GW12 marmoset neocortex. Overlay image of SPON2 (green, pseudo‐colour) and Tbr2 (red) staining (H, I, J). H, I, and J are magnified images of the areas indicated by arrows (F). In situ hybridization for SPON2 of the lateral sulcus (LS) area (K) and cerebellum (L) in P0 marmoset, and the LS area in adult marmoset (M) and adult mouse somatosensory cortex (N). qRT–PCR analysis of SPON2 expression in developing marmoset (O) and mouse (P). Note that SPON2 expression was reduced during development and disappeared by the adult stage for both species, in contrast to macaques. Differential WIF1 expression between marmoset and mouse neocortex (Q–T). In situ hybridization for WIF1 in marmoset (Q) and mouse caudal parietal cortex (R, left) and habenula (R, right). Note that in situ hybridization staining for WIF1 was seen in the habenula but no staining was seen in the neocortex. qRT–PCR analysis of WIF1 expression in developing marmoset (S) and mouse (T). qRT–PCR was performed with three animals at each stage. For qRT–PCR experiments, tissues were derived from the whole brain for E14 mouse embryos, the parietal cortex for P14 and adult mice, the whole neocortex for GW12 marmoset embryos, and the parietal cortex for P0 and adult marmosets. Scale bars are 500 μm (K, L, Q), 200 μm (A–C), 100 μm (N, R), 50 μm (F, G), and 10 μm (J).