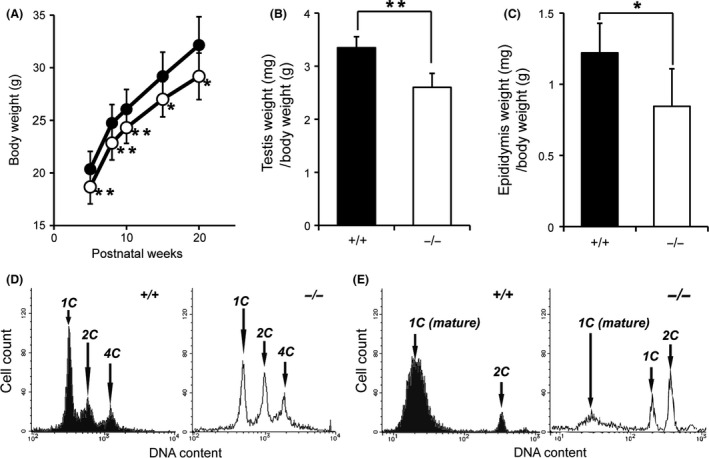
Figure 4.

Zfp318 −/− male mice (129SvJ) display reduced body, testes, and epididymides weights and less mature spermatozoa. (A) Zfp318 −/− mice (open circle, n = 10) display approximately 10% reduction in body weight compared to Zfp318 +/+ mice (closed circle, n = 10). (B) Zfp318 −/− (10 weeks old) testes display ~22.3% reduction in weight (n = 10). (C) Zfp318 −/− (10 weeks old) epididymides display approximately 30.8% reduction in weight (n = 6). A t‐test was used for the evaluation of statistical significance. *P < 0.05, **P < 0.001. (D, E) Flow cytometric analysis of the DNA content of the whole testis (D) and epididymis (E). (D) 1C, haploid spermatids; 2C, diploid cells at the G1 phase of the cell cycle (mainly Sertoli cells and spermatogonia); 4C, cells at the G2 phase of the cell cycle (mainly primary spermatocytes). Each panel is representative of four or six animals, with the data averages stated in Results. (E) 1C (mature), mature haploid spermatids with condensed nuclear DNA; 1C, haploid spermatids; 2C, diploid cells at the G1 phase of the cell cycle (mainly epithelial cells of the epididymis and spermatogonia). Each panel is representative of three or four animals, with the data averages stated in Results.
