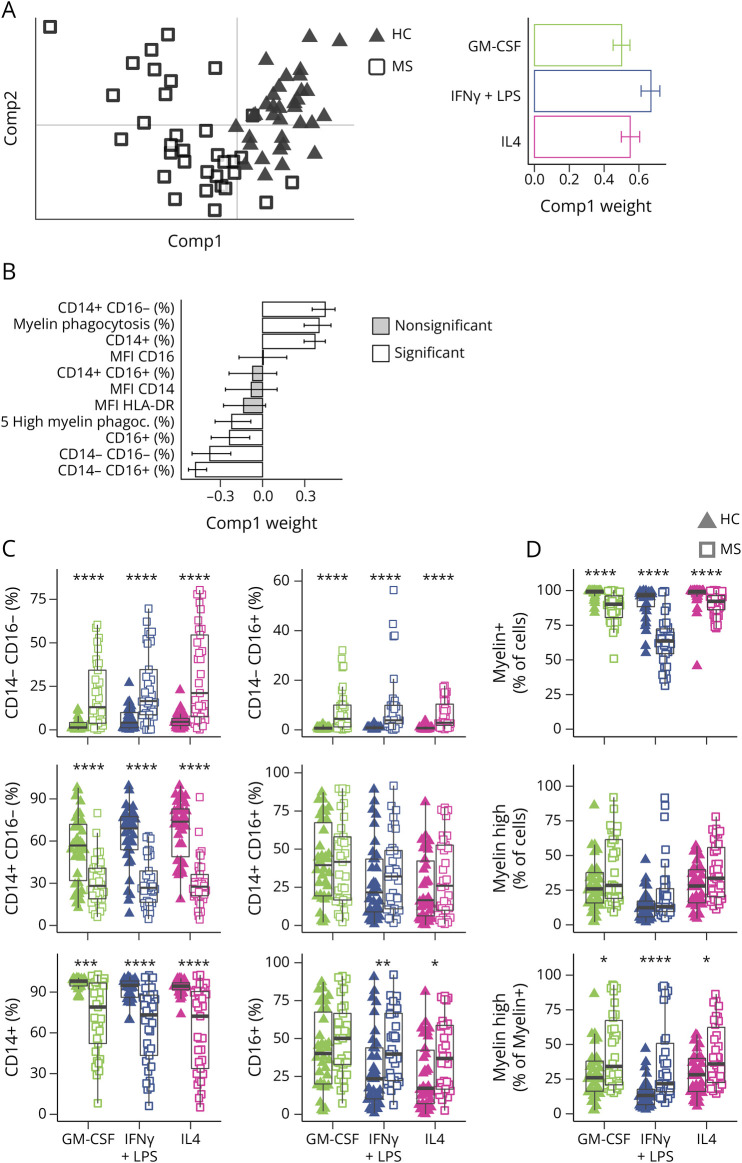
Figure 1. MS Patient Macrophages Exhibit Altered Levels of Cell Surface Marker and Functionalities Compared With HC Macrophages.
(A) PCA with the first 2 components of MGCCA targeting the differences between MS (squares) and HC (triangles) across all activation states and variables. The right panel represents the weights of each activation state to the first component of A. White bars represent variables that significantly contribute to the scores of samples. (B) Weights of each flow cytometry variable to the first component of A. White bars represent variables that significantly contribute to the scores of samples. (C) Distribution of CD14/CD16 population proportions in MS and HC for each activation state. (D) Myelin phagocytosis capacity of HC and MS patient macrophages. Data are shown for myelin positivity, high myelin positivity, and high myelin positivity as a percentage of myelin-positive cells. *p < 0.05, **p < 0.01, ***p < 0.001, and p < 0.0001 in the Mann-Whitney U test between HC and MS for each activation state. Error bars indicate 95% CI as calculated by bootstrapping (C and D). For box plots, values are grouped by activation state and disease (HC: triangles; MS: squares; GM-CSF: green; IFNγ+LPS: blue; IL4: pink). HC = healthy controls (n = 34); MS = patients with MS (n = 34).

