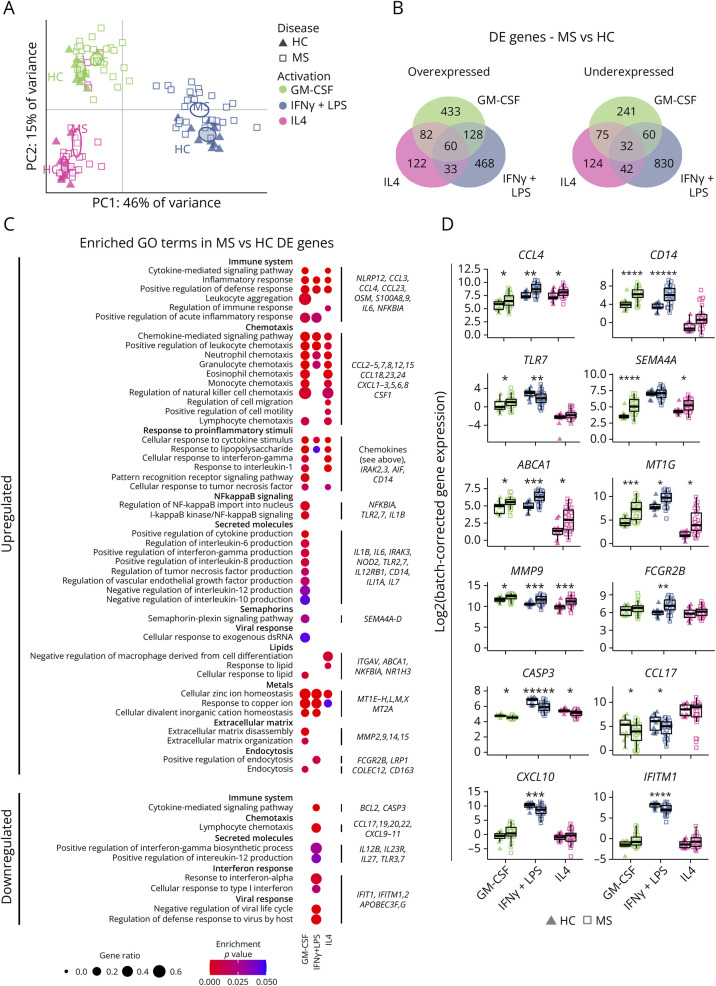
Figure 3. MS Macrophages Show a More Proinflammatory Transcriptomic Profile Compared With That of HC.
(A) PCA with each observation representing 1 sample from 1 individual (HC: triangles; MS: squares; GM-CSF: green; IFNγ+LPS: blue; IL4: pink). Ellipses indicate 95% CI of the group mean based on bootstrapping. (B) Venn diagrams showing the number of differentially overexpressed and underexpressed genes (absolute log2(fold-change) >0.5, q < 0.05) between HC and MS samples in each activation state. (C) A selection of GO terms, sorted by broader functionality, with dots indicating a significant overrepresentation in a given set of DE genes (adjusted p < 0.05). The proportion of genes from the term and the p value are indicated by the size and color of the dots, respectively. Examples of DE genes from at least 1 list of genes are provided on the right. (D) Sample distribution for a subset of genes highlighted in D. Expression is given in log2 and grouped by activation state and disease as in C. *q < 0.05, **q < 0.01, ***q < 0.001, ****q < 0.0001, and *****q < 0.00001 in limma DE analysis. GO = gene ontology; HC = healthy controls (n = 11); MS = patients with MS (n = 28).

