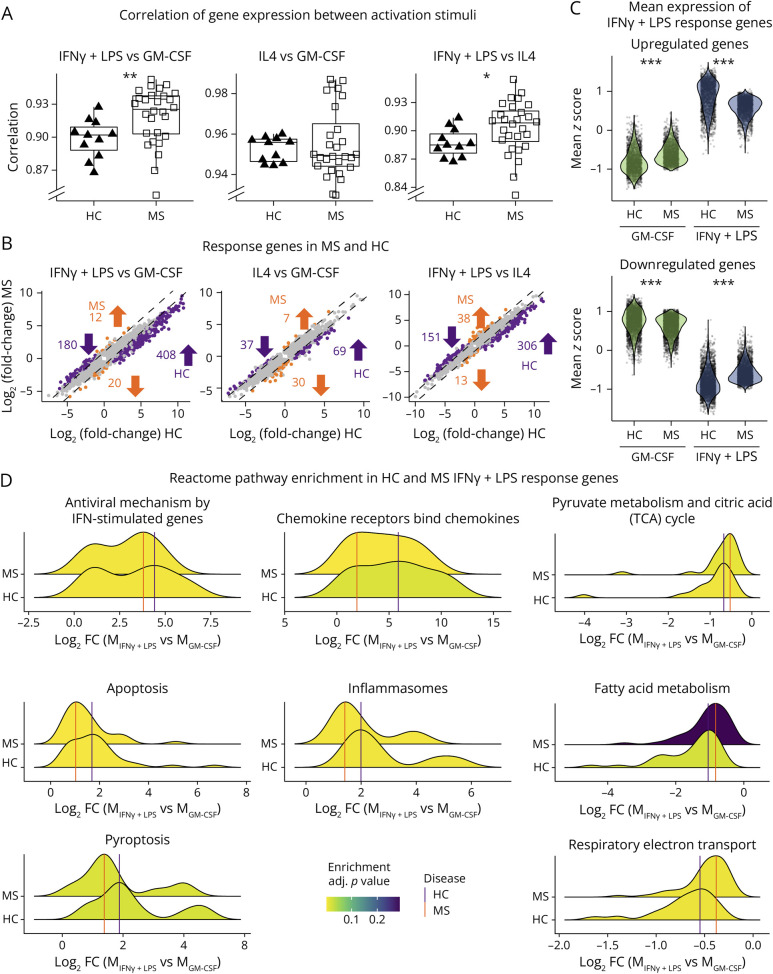
Figure 4. MS Macrophages Present a Limited Amplitude of Response When Stimulated With IFNγ+LPS.
(A) Boxplots of the Pearson correlation coefficient between gene expression in 2 activation states (IFNγ+LPS vs GM-CSF, IL4 vs GM-CSF, and IFNγ+LPS vs IL4), calculated for each individual (HC: triangles; MS: squares). (B) Scatterplots showing log2(fold-change) between 2 states in HC (x-axis) and MS (y-axis) for each gene that is DE between the 2 states in MS and/or HC. Genes with a difference in mean and median log2(fold-change) greater than 0.5 between HC and MS are highlighted in orange (larger absolute fold change in HC) and purple (larger absolute fold change in MS). Values represent numbers of genes specific to each group and direction of regulation. (C) Distributions of mean expression z-scores of IFNγ+LPS response genes, defined as upregulated (top panel) or downregulated (bottom panel) DEGs between MIFNγ+LPS and MGM-CSF in HCs. Each dot represents one gene for each group (activation stimuli and patient status). (D) Ridgeplots display the distribution of log2(fold-change) of differentially expressed genes between MIFNγ+LPS vs MGM-CSF in HCs (upper densities) and patients with MS (lower densities), divided into enriched reactome pathways. HC = healthy controls (n = 11); MS = patients with MS (n = 28). *p < 0.05, **p < 0.01, and ***p < 0.00001 in the Mann-Whitney U test (A) or Wilcoxon signed-rank test (C).

